Source: The Conversation (Au and NZ) – By Adrian Esterman, Professor of Biostatistics and Epidemiology, University of South Australia

First thing in the morning, or come 11 o’clock, countless Australians anxiously wait for the daily COVID-19 case numbers, trying to understand whether their outbreak is under control, and how much longer they will be in lockdown.
As well as daily case numbers, people want to know what proportion of cases were infectious in the community, and whether there were any unlinked or “mystery” cases.
People have also been following the daily Reff, or effective reproduction number, hoping it will get below 1, showing public health measures are working to halt the spread.
However, to have a good understanding of the dynamics of an outbreak, it is also necessary to understand k, which shows how much variability there is in daily case numbers.
COVID-19 superspreaders
Many superspreading events have occurred in the current pandemic. An infectious volunteer dressed as Santa Claus, for example, visited a care home in Antwerp in December 2020, and infected 40 staff members and more than 100 residents.
Even more drastic is a South Korean woman who caused a superspreading event resulting in more than 5,000 cases in the South Korean city of Daegu.
Read more:
How to prevent COVID-19 ‘superspreader’ events indoors this winter
Meanwhile in Australia, we have seen many examples of cases being detected, but not infecting a single other person.
So, how can this disparity be explained?
Remind me, what’s the Reff?
The effective reproduction number Reff, also called Re or R(t), tells us, on average, how many people an infected person will pass it on to. Unlike the basic reproduction number, R0, Reff takes into account that some people will be vaccinated or immune, and social distancing is in place.
So, if a virus has a Reff of 2, each infected person (primary case) will on average infect two others (secondary cases).
However, this average hides a huge amount of variability. Most infected people simply infect no one, whereas others (the superspreaders) infect many people.
Read more:
A few superspreaders transmit the majority of coronavirus cases
We’re unsure why this is the case. It could be some people are naturally social animals, or fail to maintain social distancing, mask-wearing, or hygiene.
Alternatively, it could simply be that some people have a much higher viral load than others or tend to emit virus particles as aerosol clouds more than others.
Daily case numbers can vary substantially
During periods of outbreaks, health authorities report daily case numbers. Here they are for Victoria when the fifth lockdown began:
Average daily count
The average (mean) daily count over these ten days is 10.7 cases per day (you can calculate it yourself by adding up all the cases and dividing by ten).
However, there is a lot of variability, with numbers going up and down like a yo-yo from zero to twenty. Because of this variability, we often use moving averages to try and smooth things out.
7 day moving average
For a seven-day moving average, we add up the cases from July 12 to the 18 and divide by 7, to get 8.4. Then we do the same for July 13 to the 19 to get 10.3.
This way, we end up with a much smoother series of numbers without all the up and down jags, that allows us to see trends much more easily. Importantly, I also use the moving average to calculate the Reff.
Variance
We measure the amount of variability in the daily case numbers by a statistic called the variance. This measures how far apart the daily counts are from their average value of 10.7. For most count data (for example, the number of days each month you exercise), the average and variance are the same. So, if the average count is 10.7, the variance is 10.7.
However, for this epidemic, because of the superspreaders, the variance is much greater – we call this overdispersion.
So what is the k?
An estimate of how much extra variability or overdispersion there is, is measured by a statistic called k. A small k means the variability is higher than the average daily count, whereas a large k means the variability is closer to the average daily count.
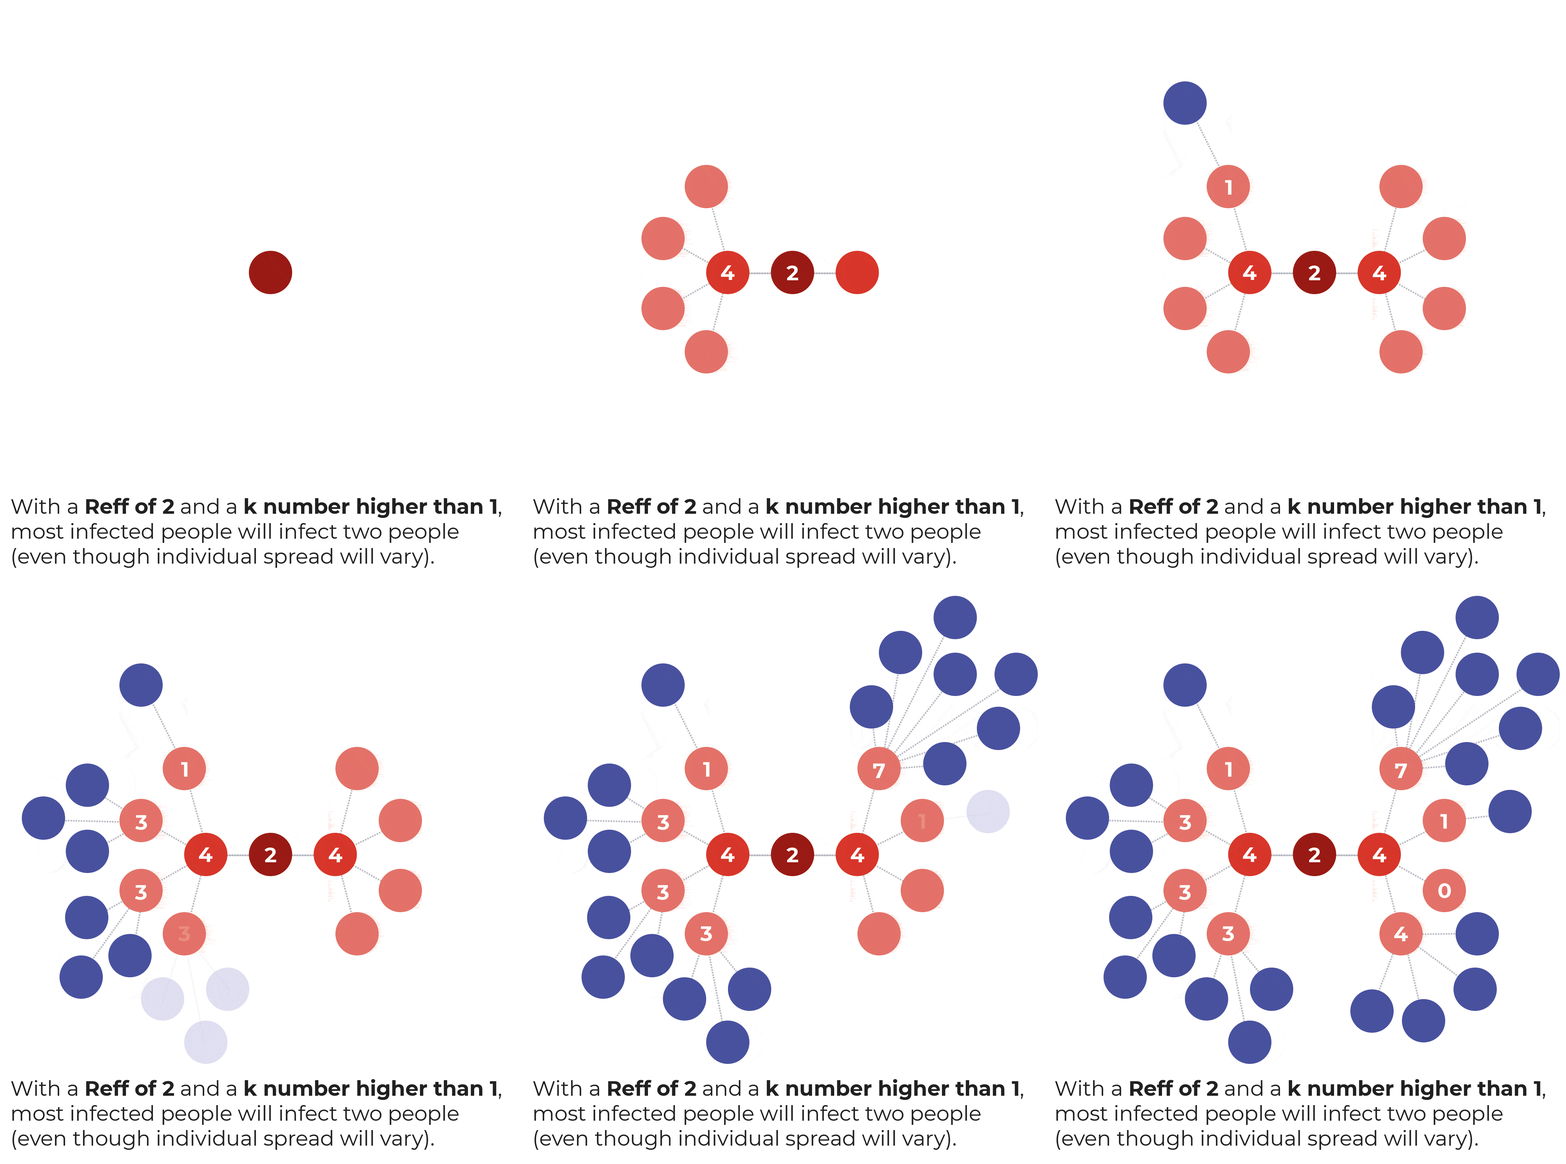
So, with a high value of k (say 2), and a Reff of 2, most infected people would typically infect two others, but it could of course be higher or lower than this.

In the above diagram, the number of people a case infects is shown in each circle. The original maroon (primary) case infects two others (red). Each of these secondary cases infects three or four others (pink), and so the outbreak continues. Typically, most infected people, infect at least one other person.
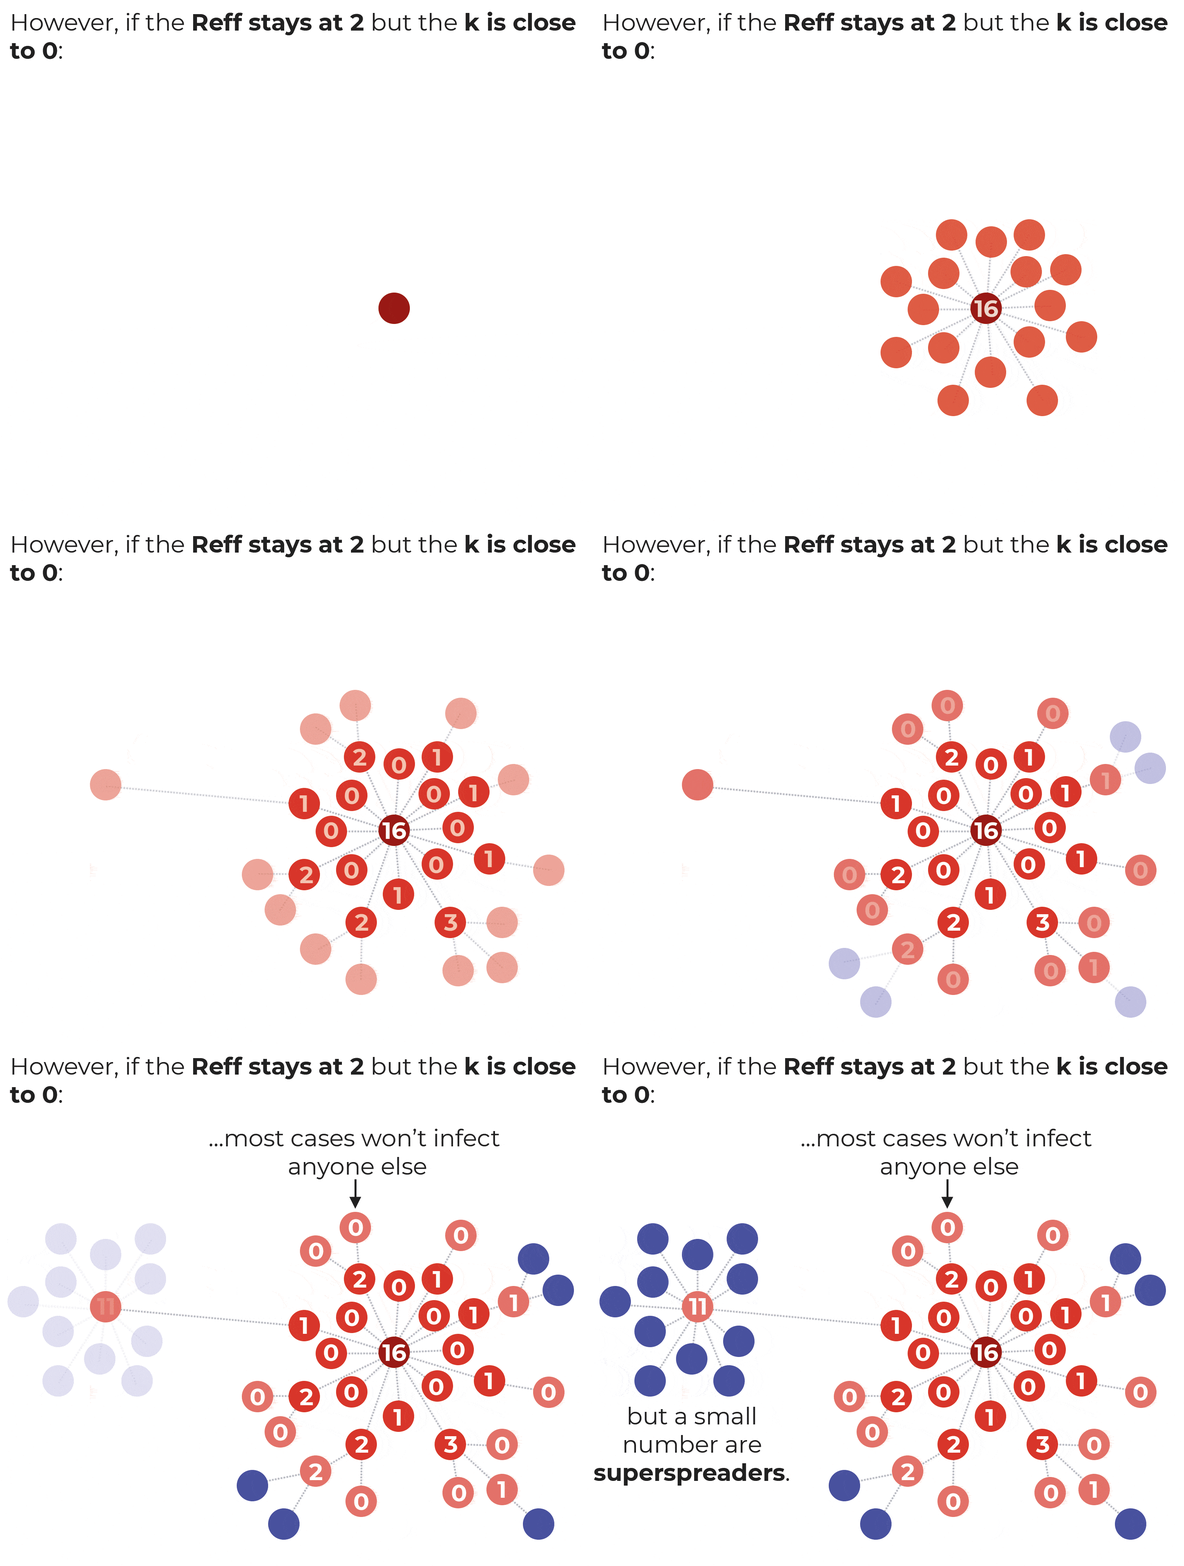
However, with k close to 0 and a Reff of 2, most people would infect no one else, and there would be one or more superspreaders.

In the above diagram, the primary case (maroon) is a superspreader, infecting 16 other people. Although most of these secondary cases do not infect anyone else, one of the tertiary cases is also a superspreader, infecting 11 others.
In both diagrams the Reff was 2. So, you can see that knowing the Reff is only part of the story.
Estimates of COVID-19’s k range from 0.1 to 0.5. These are very small values, and indicate 80% of secondary infections are caused by around 10% of primary cases. This means the majority of infectious people do not infect anyone.
Read more:
Is the K number the new R number? What you need to know
Why is it useful to know the k?
When an infected person is diagnosed, contact tracers immediately try and find their close contacts. These are then tested and put into isolation. This is called forward contact tracing.
However, in the context of superspreaders, it’s equally important to find out who infected the original diagnosed case, as that person could potentially be a superspreader.
Forward contact tracing of that potential superspreader would likely lead to many more cases being detected. In fact, modelling has found looking backwards as well as forwards could prevent two or three times as many infections. This is known as backward contact tracing and is now widely used in Australia.
The k number shows us the importance of backwards as well as forwards contact tracing.
![]()
Adrian Esterman does not work for, consult, own shares in or receive funding from any company or organization that would benefit from this article, and has disclosed no relevant affiliations beyond their academic appointment.
– ref. We’ve heard of R numbers and moving averages. But what are k numbers? And how do they explain COVID superspreading? – https://theconversation.com/weve-heard-of-r-numbers-and-moving-averages-but-what-are-k-numbers-and-how-do-they-explain-covid-superspreading-164858


