Analysis by Keith Rankin
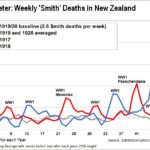
Today’s chart looks back to the years 1917 to 1920, using a sampling device I call the ‘Smithometer’. I have counted the weekly deaths of all people named Smith, from the beginning of 1917 to the end of 1920. At that time New Zealand was a country of 1.2 million people.
There are a number of death peaks due to World War 1, the largest of these being the Passchendaele battles of October 1917. Each peak represents a two-week period, effectively the middle of the week before the plotted week to the middle of the week after. For the Passchendaele peak we can say that the fortnightly death rate of New Zealand Smiths was four times normal.
We can apply that more generally, concluding that about 75 percent of New Zealand deaths in the period from 3 October to 17 October 1917 were due to WW1 activities; most notably the Passchendaele battle of 12 October.
The influenza pandemic hit New Zealand hard and fast, in mid-November 1918. Over two weeks the Smith toll was ten times greater than the baseline rate of 2.6 Smith deaths per week. (Note that the influenza figures are slightly muddied by the WW1 battle of Le Quesnoy on 4 November.) Otherwise it would look like a perfect spike in the chart. Also, a number of New Zealand soldiers succumbed to the pandemic while in Europe or the United Kingdom; the peak dates differed in different countries.
The overall influenza pandemic death toll of New Zealanders was somewhere between 5,000 and 10,000; that’s between half a percent and three-quarters of a percent of the New Zealand population. (Compare this to the likely worst case for Covid19 – Belgium – which will end up with a death rate from Covid19 infection at less than one in a thousand.) Given that we already know about the severity of the 1918 pandemic, the surprise is how quickly the event in New Zealand finished. The chart shows that by mid-December 1918 Smith deaths were back to normal.
What will a Smithometer chart for 2019 to 2022 look like? First, we should note that Smiths today are a smaller proportion of the population, and a Smith sample would be biased against non-Pakeha.
However, we know that Pakeha are overrepresented in New Zealand in Covid19 cases, and – to the best of my knowledge – all deaths so far have been Pakeha. So far, not a single death has been recorded in Auckland, and the known incidence of Covid19 is 44 percent higher in the Pakeha-dominated South Island than in the North Island.
It is unlikely that deaths of Covid19 (ie deaths with Covid19 in the death certificate) will register on the New Zealand Smithometer, though they will cause a bump on a United Kingdom Smithometer.
The important question, however, is the impact of Covid19 on the overall death rate, and for that we would want to go at least until the end of 2021.
In 2020 it is likely that the Covid19 influence on the Smithometer will be negative, because ongoing social distancing will most likely substantially reduce the rate of deaths from influenza and pneumonia.
So the question will be the extent of economic chaos in the wake of Covid19, and the extent that such chaos may translate into extra deaths. My guess, from having studied the Great Depression of the early 1930s, is that the overall effect on deaths will also be negative. (Certainly the New Zealand death rates did not rise during or after the 1930s’ Depression, though it could be argued that World War 2 would not have happened had there been no Great Depression in Europe; the Depression was an economic pandemic.)
At least in terms of deaths, I am also optimistic that there will be very little economic chaos in New Zealand in 2020 and 2021. I am expecting a soft-landing here, though not necessarily in Europe. The overall impact of Covid19 in New Zealand will almost certainly depend on what happens outside of New Zealand.
We will also need to be careful about interpreting global death rates in the 2020s. With the huge public health issues around unaffordable housing, around antibiotic resistance, around obesity, and substance abuse/addiction (eg opioids in the United States) there have been signs that First World life expectancy was already peaking. It seems to me more likely that, if life expectancy rates fall this decade, then Covid19 will not have been the main cause.
We have some reasons to be optimistic about how the world will turn out this decade, especially as Covid19 has caused many of us to reflect on improvements we will make to our own lives (and to our understandings of the weaknesses of the form of capitalism – based on private property – that we have taken for granted), rather than waiting for THEY (ie someone else) to fix things. One of the great legacies of the Great Depression – a legacy for the better – was the intellectual activism that it precipitated.
Covid19 will not be the short and sharp event that the 1918 (1919 in some other countries, such as Samoa) influenza pandemic was. It will be useful to run the Smithometer on the present period. It is possible that the overall impact of Covid19 on deaths will be negative, meaning that fewer deaths may occur in the 2020s than would otherwise have occurred.
PS
The chart shows higher 1919 and 1920 death rates than usual in the early spring of those years. That may be due to a return to regular patterns of deaths peaking as a result of the ‘winter flu season’. It will be interesting to see if that seasonal pattern persists into later years. Indeed, returning to this century, possibly in this year’s northern hemisphere spring, many of the deaths have been of people who in other more familiar years would have died from other more familiar viruses.