
Source: The Conversation (Au and NZ) – By Richard Holden, Professor of Economics, UNSW
The latest Programme for International Student Assessment (PISA) results are bad news for Australian students, parents, employers and policymakers. Pretty much everyone.
Australian 15-year-olds are now below the OECD average in mathematics, and our results in reading and science have fallen badly.
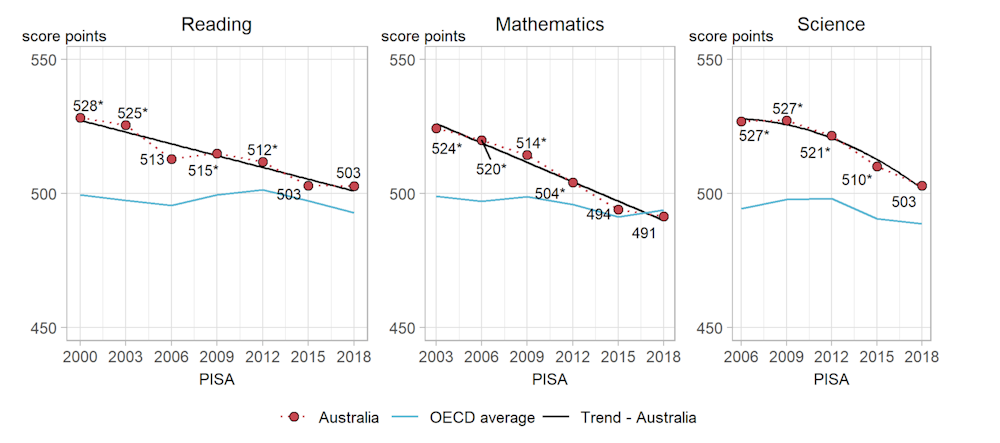
Reading has gone backwards by three-quarters of a school year since 2000, mathematics by more than one school year since 2003, and science by a school year since 2006.
Read more: Aussie students are a year behind students 10 years ago in science, maths and reading
The results have generated a firestorm of press coverage, and it’s true they are certainly alarming.
They underscore the need for a serious discussion about education reform in this country.
They also help explain our poor productivity growth in recent years, and are full of gloomy news for future employment prospects and income inequality.
Skills and productivity
While no test is perfect, PISA is pretty useful for understanding the skills young people are equipped with as they enter the workforce or embark on post-secondary education.
This is because, as Australian Council for Educational Research chief Geoff Masters has pointed out:
Unlike many tests and examinations, PISA does not assess students’ abilities to recall facts or basic literacy and numeracy skills. Instead, it assesses the ability to transfer and apply learning to new situations and unseen problems. This requires an understanding of fundamental concepts and principles, as well as the ability to think.
This week the Australian Bureau of Statistics published figures revealing a 0.2% fall in labour productivity for 2019, with a shocking 0.8% fall adjusting for the quality of work performed.
Many factors contribute to labour productivity, but what economist call “human capital” (essentially “skills”) are a key part. With the skills of Australia’s workforce and future workforce falling, is it any wonder that productivity is lagging?
That’s a big problem for wages growth. In the long run, one basically expects real living standards for workers to track productivity. There can be deviations for certain time periods, but as Nobel laureaute Paul Krugman famously put it in 1990:
Productivity isn’t everything, but in the long run it is almost everything. A country’s ability to improve its standard of living over time depends almost entirely on its ability to raise its output per worker.
Widening the gap
The PISA results also tell us we have also dropped relative to other countries. In a world where routine tasks are increasingly being automated and there is fairly strong international mobility of labour, that’s doubly concerning.
Our ability to compete in a globalised world of competitive international trade depends not only only our absolute level of skills but our relative level of skills.
Take mathematics. Our PISA scores are now comparable to those of Portugal, and behind Latvia and the Czech Republic. Estonia – with a GDP per capita that’s half ours – is miles ahead of us. We’re even getting beaten by New Zealand.
A final piece of depressing news is that we have fewer top performers and many more poor performers. In NSW, for instance, our number of poor performers has doubled since 2003 (from 10% to 20%). Our number of top performers has roughly halved over the same period.
As University of Chicago economics professor Michael Greenstone has emphasised, the fundamental fact of labour economics is that people get paid for their skills.
If the spread of skills between the best and worst students in Australia is getting wider, then we should expect income inequality to worsen. The tax and transfer system in Australia does a lot to mitigate that inequality, but there are limits.
What to do?
So how to improve Australia’s education system?
As I have pointed out previously, the international evidence on “what works” in education involves some things that cost real money and others that are basically free.
An excellent 2013 paper by economists Will Dobbie and Roland Fryer used data from New York City charter schools to calculate that five policies explained about 45% of the variation in school effectiveness. Those policies were:
frequent teacher feedback, the use of data to guide instruction, high-dosage tutoring, increased instructional time and high expectations.
Of course, people can argue about the “external validity” of causal effects in specific geographies or educational contexts. That’s why we need good evidence from randomised controlled trials in education in Australia.
But make no mistake: the cost of failing to improve the skills of our children and future workforce is huge.
It has dramatic implications for productivity, living standards and income inequality.
And it’s too important for ideological commitments on the left or the right to prevent real reform. The only thing that matters is “what works”.
– ref. Vital Signs: Australia’s slipping student scores will lead to greater income inequality – http://theconversation.com/vital-signs-australias-slipping-student-scores-will-lead-to-greater-income-inequality-128301