Analysis by Keith Rankin.
Regional population estimates are unreliable. The government should know (and publish) reliable quarterly population data for the country as a whole, and accurate breakdowns by age and sex. All that is required is birth and death registration, accurate immigration and emigration data (age and sex are determinable from passports), whether a person passing through the border is a visitor or a resident, and when a visitor’s status changes to resident status.
In March 2014, Statistics New Zealand was still publishing population data (eg for March 2013) uninformed by the 2013 Population Census. By March 2015, these estimates had been corrected.
My analysis uses the Working-Age Population (population over 15), published as part of the Household Labour Force Survey. The 2014 estimate of the March 2013 aged-over-15 population was 3,508,000. After the census results came through, this was revised down by 39,000 to 3,469,000. New Zealand’s working‑age population had been overstated in 2014, by over one percent. The discrepancy should have been much smaller, and may be due in large part to poorly-collected immigration statistics, based on travellers’ stated intentions rather than their actual movements.
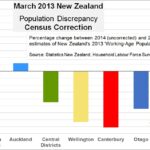
Some of the regional discrepancies were much bigger than the one percent nationwide discrepancy. (The regions given in this chart approximate closely to the six provincial cricket associations in New Zealand.)
The population increase in the Northern Districts (Northland, Waikato, Bay of Plenty) was much bigger than anticipated by Statistics New Zealand in their pre-2013-census population estimates. My analysis of 2017 election statistics suggests that this relative growth of the Northern Districts has continued apace.
Between 2006 and 2013, Auckland grew slightly faster than projected by Statistics New Zealand. My 2017 analysis suggests that since 2013 – that is, considering March 2018 – the Auckland population will be significantly less than Statistics New Zealand’s current projections for Auckland.
From the central North Island to Southland, the 2013 censuses showed a much greater loss of population than expected. While the population loss in Canterbury was no surprise, the surprise is that Statistics New Zealand were doggedly publishing Canterbury population estimates in March 2014 as if the earthquake had never happened.
I’m guessing that the 2018 census will be close with respect to New Zealand’s overall population. With respect to the regions, however, I suspect that all regions except Auckland will show higher census‑informed populations for March 2018; higher than the March 2018 estimates for March 2018 will show. My analysis in 2017 suggests that the 2018 Census will show that there has been a population redistribution since 2013, in favour of the regions and against Auckland.