Members of the Australian screen industry have been shocked to learn one of the nation’s most successful and prolific production companies, Matchbox Pictures – and its subsidiary Tony Ayres Productions – will shut their doors this week.
Matchbox was closed by its parent company, Universal International Studios, and the closure has resulted in the loss of 30 full-time equivalent positions.
The reasons cited by Universal are vague. According to a media release, “extensive evaluation of the business and the broader production landscape” influenced the decision. The global production arm of NBCUniversal has said it will take on new business and talent on a case-by-case basis from here on.
This is crushing news for the local screen industry, which finds itself increasingly beholden to decisions made by overseas corporations.
18 years in the making
Matchbox Pictures was founded in 2008 by screen industry stalwarts Tony Ayres, Penny Chapman, Helen Bowden, Michael McMahon and Helen Panckhurst.
Together, they have made some of Australia’s most iconic television series including The Slap (2011). This series changed how the world perceived Australian drama, as an innovative, gritty morality play remade in the United States.
The Matchbox team was also responsible for other critically acclaimed and AACTA Award winning projects, such as Secret City (2016–19), Stateless (2020) and Glitch (2015–19), among others.
More recently, they gave us The Survivors (2025), the best performing local TV drama on Netflix in 2025.
As one of the bigger employers of local talent and crew, one might ask how this happened.
Acquisition by Universal
In 2011, Matchbox sold a majority stake to NBCUniversal. At the time it seemed like a shrewd move. It meant the company, which is headquartered in Sydney with offices in Melbourne and Singapore, would get better access to international markets, stronger global distribution channels, and the ability to upscale productions.
However, it also meant Matchbox was subject to global winds of change, rather than local breezes. And the wind is blowing. Comcast, which owns NBCUniversal, is in downturn, reporting a significant revenue decline and job cuts in 2025. This means they’re probably eager to lighten the load.
Another reason is the changing nature of streaming content regulation in Australia. The Labor government’s move last year towards regulating local content quotas for media giants such as Netflix was a big win for advocates.
But it also introduces uncertainty, which means international companies may choose to withdraw from the region instead of investing in Australian content.
There is no law requiring overseas content providers to maintain a presence in Australia. Although Universal has said it will continue to do business here, the new environment arguably makes maintaining a fully-staffed production arm less attractive.
The Matchbox closure is the first clear example of this.
So, where does the recent closure leave the local industry? For one thing, we’re likely to see reduced capacity to nurture in-depth, large-scale local productions.
It also makes the future uncertain for up-and-coming practitioners, especially those from diverse backgrounds, which Matchbox was well-known for championing. The shutdown means the loss of salaried jobs and a consistent commissioning pipeline.
Matchbox was also a steady source of contract work for freelancers – whose situation is now even more precarious.
It’s possible the closure will lead to more opportunities for mid-size producers pitching their projects to broadcasters, studios and streaming platforms – especially with the introduction of new streaming quotas for local content.
There are some left in Australia that may step in to fill the gap: Hoodlum Entertainment, CJZ, Curio Pictures, Endemol Shine Australia, See-Saw Film, Beyond International and Goalpost Pictures spring to mind.
Then again, some of these are also owned by overseas interests. It’s a “watch this space” situation.
Wellington Water said over the past 24 hours, the short 5-metre pipe close to the shoreline had not been spewing raw sewage, and the long outfall pipe was being used instead.
On 4 February the plant failed – sending millions of litres of raw sewage into Cook Strait every day.
This map shows the Moa Point sewage spill along Wellington’s south coast. The pipeline network is shown in red, including the 5-metre and 1.8-kilometre long outfall pipes discharging to the ocean.Supplied, CC BY-NC-ND
In an update on Thursday, Wellington Water said due to heavy rain this past Monday, bacteria levels around the plant’s short outfall pipe and southern coast beaches had increased.
“Public health advice remains the same: it is strongly recommended for the public stay out of the water on the South coast of Wellington. Do not collect kai moana,” it said.
It said it hadn’t found any structural issues with the long outfall pipe – such as a blockage – which was restricting flow through the pipe.
Wellington Water said it was trying to increase the volume of sewage that could be pumped to the long pipe – because after its equipment failure – it can’t cope in wet weather.
It expected construction work on a large air vent on the outfall pipe to begin this weekend, with the aim this will help improve the flow through the long pipe.
“Workers are onsite at Moa Point, continuing to assess the damage, working to manage odour, and manage network flows.
“As part of the damage assessment, experts are being flown in from Sydney to assist.”
Wellington Water also warned residents about a stink coming from the plant since it failed.
It said crews were clearing wastewater and sludge from the plant as quickly as possible, and it expected that to be done by early March.
“Odour monitors are being installed to measure the impact at sites surrounding the plant. We have one unit available and will confirm when this is in place.”
Meanwhile, the water operator had warned residents living near the southern landfill of an increased bad smell on Thursday, as it carried out unplanned work at the Carey’s Gully sludge dewatering plant.
“Carey’s Gully usually manages the sludge from the Moa Point Wastewater Treatment Plant,” it said.
“Because the plant is currently closed, the sludge tanks at Carey’s Gully are not being used and so the unplanned maintenance involves draining these tanks.”
The work should be completed by the end of Thursday, it said.
In September last year a stash of more than 200 papers were found in a locked cupboard within a mayoral desk that was bought from Wellington’s Tip Shop.123RF
Confidential documents discovered in a former Wellington mayoral desk sold to a member of the public should have been destroyed, a review has found.
It’s also revealed the desk was checked three times before its sale.
In September last year a stash of more than 200 papers were found in a locked cupboard within the desk bought from the Tip Shop, a second-hand store at the city’s landfill.
Furniture from the Wellington Town Hall was sold there during the building’s redevelopment.
The council has been investigating how the items were sold, and why confidential documents were not removed from them.
The documents were dated between 1988 and 2004, during which time Sir James Belich, Dame Fran Wilde, Mark Blumsky and Dame Kerry Prendergast were mayor.
When the papers were discovered, Dame Kerry said they were “potentially incredibly damaging”.
The agenda for next week’s Audit and Risk committee meeting show the “desk privacy incident” will be discussed.
The council carried out an internal review and also commissioned Grant Thornton to carry out a review, the agenda shows.
The Grant Thornton review found the storage of the documents – which included personal information like names and email addresses – did not follow council policy.
It said a number should have been destroyed, and others should have been destroyed after seven years, while two should have been archived.
“From an interview with an ex-Mayor, we understand the documents were created and deliberately stored outside of the WCC filing system as they were considered confidential to the Mayor, due to the nature of the documentation, reflecting the Mayor’s responsibilities regarding the Council Chief Executive and elected members.”
It was unclear whether the council knew about the documents, but mayoral staff would have, it said.
The desk had been checked for documents three times as it was moved from place to place – once in 2013 and twice in 2025.
The last inspection was at the Tip Shop, where “all drawers were found to be empty, and the item was cleared for removal and sale”.
The review said there was no evidence to consider whether the locked cupboard was not noticed, or if it was noticed but not checked.
“While WCC were unaware of the documentation in the locked cupboard in the desk, there were three opportunities for the
cupboard to be identified, opened and the documents retrieved,” the report said.
“The disposal processes do not appear to be consistent with the requirements of the Council Privacy Policy to ensure ‘everything reasonably within the power of the agency is done’.”
Elected members were not bound by council policies but the council could do better by giving greater support around record-keeping, it said.
The council’s “key challenge” was increasing the awareness of risk and the importance of following policies among staff, it said.
It recommended the council establish an asset disposal policy, strengthens its procedures, improves information management training, and enhance “relocation controls”.
The council’s internal review found it breached two privacy principles: storage and security, and retention.
It accepted both reviews’ findings and has since updated Tip Shop’s operating procedures, commissioned a formal asset disposal policy, strengthened its relocation and furniture checking processes, and enhanced “elected member transition processes to support the return of confidential physical documentation”.
It’s also considering mandatory information management training, and has checked remaining furniture in storage to ensure no more documents were “overlooked”.
In this living zebrafish larva, the lymphatic vessels are fluorescently labelled red, while blood vessels are green, allowing scientists to visualise vessel growth.SUPPLIED
The larva of a stripey fish could be the key to preventing a chronic and painful swelling condition that’s a common side effect of some breast cancer treatment.
The condition could be congenital or caused by an injury, but it mostly occurred as an unintended consequence following breast-cancer treatment.
Auckland University scientists discovered a molecule in zebrafish larva that offered hope of eventually treating or preventing the condition.
Lead researcher Dr Jonathan Astin, told Checkpoint, the larva of zebrafish were often used to answer scientific questions as the larva was almost completely transparent, making it easy to fluorescently label any organ system.
Astin said the way a human embryo developed was initially almost identical to a fish embryo – so the hope was what was discovered using zebrafish could be directly translated into understanding human development and disease.
In Astin’s lab, the lympahtics of the fish were tagged to help understand how lymphatics form and how lymphatic diseases could be treated.
The scientists discovered a growth-promoting molecule, known as ‘insulin-like growth factor’, or IGF, accelerated the growth of lymphatic vessels in zebrafish, so it had the potential to repair damaged vessels.
“What we’ve done subsequently is grown human lymphatics in a dish and put this human IGF on and that has been able to stimulate human lymphatic growth,” Astin said.
“Finding the molecule in fish allowed us to identify it might be therapeutic and find the human version.”
Astin said lymphoedema was often seen in breast cancer patients, with some estimates that around 20 percent of patients who had lymph nodes removed as part of breast cancer treatment having lymphoedema develop in one of their arms.
The condition was very difficult to cure once a person had it, Aston said, because the fluid build up caused tissue damage which could be hard to reverse, but the hope was it could be prevented.
“The plan would really be prevent it form occurring in the first place, so we hope by identifying this new IGF, it may be part of a treatment cocktail where we might be able to provide these lymphatic stimulating growth factors to patients who have lymph nodes removed in order to prevent the onset or the incidents of lymphoedema.”
Any possible treatment would still be many years off, Astin said, as work was still being done to understand whether it could stimulate repair and the it would need to be tested for safety.
“But this is the first new lymphatic growth factor we’ve identified in many years.”
A pack of roaming dogs in bush near Paihia in the Bay of Islands.RNZ / Peter de Graaf
Further calls have been made for more to be done about dangerous dogs, in the wake of Tuesday’s fatal dog attack in Northland.
Mihiata Te Rore, 62, was killed by a pack of three dogs at a property in the small town of Kaihu on Tuesday. She was the third person to be killed by dogs in the region in four years, and fourth nationwide.
It has prompted calls for change from as high up as the prime minister, meanwhile RNZ has been contacted by multiple dog attack victims who have shared their frustration at what they say is a lack of action by authorities.
But multiple organisations have been calling for a change at a policy level, including the SPCA, which said the Dog Control Act was “hopelessly out of date”.
Whangārei man Jade Campbell was among the dog attack victims calling for more to be done.
“They stick their head through the hedge and bark at us, and they’ve frightened the missus off the bottom of the section with the boy, the boy’s only two years old,” he said.
“They’re aggressive, they’ve come over and killed our cat.”
He said the council hadn’t done anything in response.
Campbell believed owners should have the legal right to destroy a dog if it roamed onto their property.
“A bite and a couple of shakes will kill a young child easily, so the law basically says I have to wait until the dog kills my son before I can kill the dog.”
Under New Zealand law, it was only legal to kill a dog if it was actively attacking a person or animals.
Whangārei District Council’s manager of health and bylaws Reiner Mussle said they investigated every complaint they received, including Campbell’s case.
“Unfortunately, the cat was found in a decomposed state and there was insufficient evidence available to determine how it died or to establish that a dog was responsible,” he said.
“While historic dog footprints were identified on the complainant’s property, these indicated that dogs had been present in the area at some point in the past, but there was nothing directly linking those footprints to the death of the cat.”
Mussle said they were actively monitoring the issue of non-secured dogs in the wider area, and taking action where required.
But the issue is not just in Northland.
More than 200 children aged under 15 and nearly 3000 adults were attacked by dogs in Auckland between July 2024 and June 2025.
Papatoetoe resident Krish had been chased through the street by roaming dogs. His cat had also been killed.
He said more needed to be done.
“It’s been a pretty devastating loss for our family, so I’m trying to make it my mission over the next few weeks to actually get something done about it,” he said.
Krish had engaged lawyers about his case, and wanted to speak to his local MP about boosting enforcement for unruly dogs.
“If you have an off-leash dog, there needs to be more punishment for it, almost like an instant impound or severe fines, or just no off-leash dogs almost,” he said.
“And then possibly looking into banning dangerous dog breeds or unleashed dogs.”
Police said the dogs involved in the Kaihu attack were with Animal Control and would be destroyed.
Former Gisborne deputy mayor Josh Wharehinga has been appointed as the new president of Boxing New Zealand as the sport grapples with complaints about its head coach.
The Sport Integrity Commission has been investigating Boxing NZ and its head coach Billy Meehan.
Cathy Meehan, who is the wife of Billy Meehan, recently stepped down from her role as president of the organisation.
Commonwealth Games medalist Tasmyn Benny said Meehan killed her passion for the sport.
Described as a ‘boys club’ rife with verbal abuse, sexually inappropriate behaviour and misogyny, Benny said she was made to feel powerless and without a voice in the environment.
“You can’t really go to Boxing New Zealand because it’s all made of his family and friends. They’re all in the same circle,” she told RNZ.
After winning bronze at the Commonwealth Games in 2018, Benny said she noticed a shift at the organisation.
“All the management and coaching changed for New Zealand boxing and that’s when everything went downhill. Billy was in charge the whole time.”
Meehan has not responded to the allegations. The Integrity Commission has defended the delay in a resolution.
Billy Meehan.Supplied/ NZ Boxing
Wharehinga served four terms on Gisborne’s council – two as deputy mayor – before stepping away from local government earlier this year to concentrate on his business interests and reinvigorating boxing in Tai Rāwhiti.
The respected referee and judge thanked his colleagues on the Boxing New Zealand executive for “entrusting me with this important responsibility,” Wharehinga said.
“The first thing I’d like to do as incoming president is pay tribute to Cathy for her tireless, selfless service to boxing in Aotearoa. Cathy is a tremendous kaitiaki of the sport and will continue to be an important contributor to our future success.
“I’m incredibly passionate about boxing. It has been a huge part of my life so to be appointed to this role at an important time for the sport is a huge honour,” he said.
Local businessman and Otago Boxing Association member Bryan Usher has been appointed vice president, replacing Mark Fuller.
Source: The Conversation (Au and NZ) – By Maria O’Sullivan, Associate Professor of Law, Member of Deakin Cyber and the Centre for Law as Protection, Deakin University, Deakin University
In the wake of the Bondi terror attack, multiple state governments have passed laws to restrict mass protests. Most notably, the New South Wales government introduced controversial legislation giving police the power to restrict public protests for up to 90 days after a terrorist incident.
This unprecedented restriction was tested when thousands took to the streets to protest against the visit of Israeli President Isaac Herzog.
The protest was followed by widespread allegations of police brutality. These are currently being investigated by the state’s police watchdog.
The organisers of the protest are also challenging the constitutional validity of the laws in the NSW Court of Appeal.
This latest round of law reform follows long-running concerns about whether the right to protest in Australia is under threat. Two years ago, the Human Rights Law Centre found “protest is in peril”. Little has changed since.
So, what do these state laws do, and how might they affect people’s democratic right to protest? How can lawmakers strike the right balance between human rights and the protection of public safety?
States tightening anti-protest laws
The right to protest has been restricted in many of Australia’s states and territories over recent years through increased fines and sentences for acts such as traffic obstruction.
These laws have been further tightened in the past year.
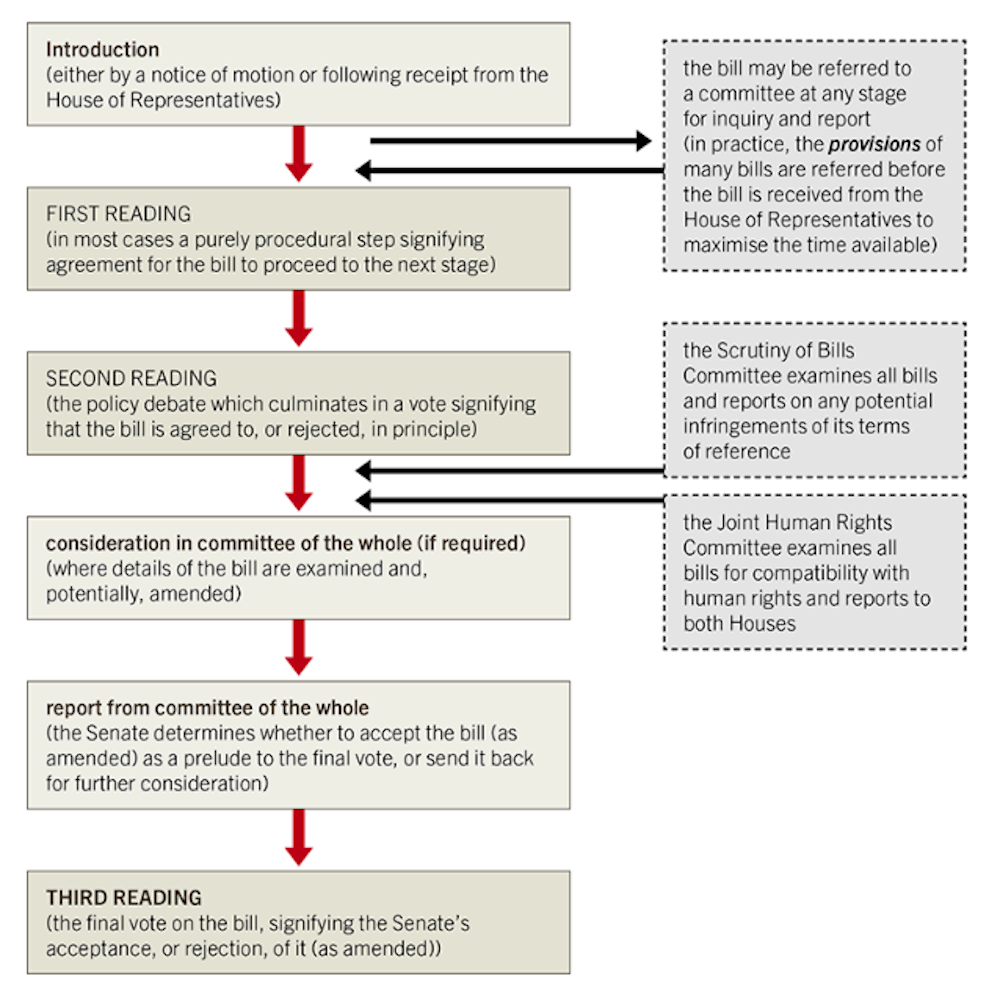
In NSW, the government passed legislation in December 2025 to allow the police to make a “Public Assembly Restriction Declaration”, following a terrorist attack.
As the name suggests, such a declaration means specific areas are restricted places for protest. If the police make this declaration, it grants them additional powers to:
move people on
close specific locations
search people inside a designated area
and issue orders to prevent disruption or risks to public safety.
A number of these declarations were made by NSW Police during the protests against Isaac Herzog’s visit.
The declarations have now lapsed, so they’re no longer in operation. However, the legislation allowing police to make them remains in force.
What about in other states?
In Queensland, draft legislation is currently before parliament. It will, among other things, allow the Queensland government to ban certain protest slogans.
If passed, it will be an offence to publicly use a prohibited expression in a way that “might reasonably be expected to cause a member of the public to feel menaced, harassed or offended”. This offence carries a maximum penalty of two years in prison.
Under this legislation, the government has announced they intend to ban two phrases: “from the river to the sea” and “globalise the intifada”.
In Western Australia, the government has introduced a bill allowing police to refuse a protest permit if they believe the protest is likely to promote hate based on factors such as religion, race, disability, gender, sexuality or ethnicity.
While various protest restrictions have existed for some time, the recent use of police “declarations” is concerning. They may lead to disproportionate use of force or discriminatory policing practices.
Some of the new hate speech offences are also problematic as they exclusively restrict protest slogans used by some pro-Palestinian protesters. These laws can therefore be seen as targeting particular political causes.
Protesters pushing back
A number of challenges to government restrictions have been lodged with varying success in recent months.
In Victoria, protesters challenged a “designated area” declaration prior to the 2026 Invasion Day rallies. The Federal Court found in favour of the protesters, dismissing the declaration as unlawful.
The declaration gave police the power to search a person or vehicle without a warrant and to direct a person to leave the designated area if they refused to remove a face covering when requested to do so.
Invasion Day marches in Melbourne weren’t affected by police ‘stop and search’ powers after a successful court challenge by protesters.Jay Kogler/AAP
The court found the declaration unlawful for a number of reasons. First, the assistant police commissioner did not apply the correct legal criteria and did not satisfy key requirements under the relevant legislation. This meant there was a legal error in the way the decision was made.
Second, the assistant commissioner failed to give proper consideration to the right to privacy under the Victorian Charter of Human Rights.
In NSW, the Palestine Action Group recently tried to overturn a government declaration that Israeli President Herzog’s visit would qualify as a “major event” under the Major Events Act.
That declaration was significant because it granted police many of the additional powers outlined above.
That challenge, which had to be brought to court at short notice, did not succeed.
What can we do?
While governments in Australia are correct to address the perils of hate speech and consider public safety, there is a real concern that current legislation is weighted too heavily on the side of protest restriction.
One way lawmakers can strike a balance between the right to protest and other considerations is to adopt a human rights charter. This would include a formal process for considering the right to protest (and other rights).
Importantly, this should also enforce an obligation on police to consider the right to protest when making decisions (as occurs in Victoria under its state charter).
There have also been calls for a federal human rights act, as well as the introduction of human rights charters in states and territories that do not have one.
Combined, this would enshrine important legal recognition of our right to protest, which is fundamental to the functioning of a healthy Australian democracy.
You might have heard the common claim that electric cars aren’t really green – that their lithium-ion batteries rely on “blood” minerals such as cobalt, mined in terrible conditions.
The critique had some truth to it. But this claim is no longer accurate. Electric vehicle (EV) manufacturers have been shifting away from cobalt because it’s expensive, toxic and ethically fraught.
What’s replacing it? Cheaper lithium-ion battery chemistries based on lithium iron phosphate (LFP), which avoid cobalt entirely. If you remember high-school chemistry, you’ll remember batteries have an anode and a cathode. The anode is nearly always graphite. But the cathode can be made from many different minerals and compounds.
This means battery makers have a great deal of choice over which minerals to include. There’s huge innovation taking place in batteries, as the market grows and diversifies across vehicles and energy storage. Even cheaper chemistries are emerging based around salt (sodium-ion), while high-performance solid state batteries are coming close to reality.
For years, cobalt has been a mainstay in cathodes due to its useful properties, including how much energy it can help store.
When the first commercial lithium-ion batteries arrived in the 1990s, the chemistry relied on cobalt (lithium cobalt oxide). Over time, lithium nickel mangananese cobalt (NMC) oxide and lithium nickel cobalt aluminium (NCA) oxide came to dominate the market, as their high energy density made them ideally suited for portable electronics.
As demand for lithium-ion batteries accelerated, sourcing cobalt began to be a problem. Three quarters of mined cobalt comes from one country: the Democratic Republic of Congo (DRC), which has half the world’s reserves. Australia is second, with 20%.
Cobalt is toxic. In the DRC, many people risk their health in small mines under conditions often described as slave-like. Illegal and legal mines can do huge environmental damage.
This and other issues led researchers to begin working on reducing or cutting cobalt out altogether. This led to low-cobalt chemistries, in which most of the cobalt was swapped for nickel, manganese or aluminium. To date, it’s been difficult to remove cobalt entirely, given how much of a boost it gives to battery capacity and stability.
In parallel, US researchers found the mineral olivine – made of lithium, iron and phosphate (LFP) – was a good candidate for battery cathodes. This discovery gave rise to cobalt-free LFP batteries. LFP chemistry is cheap, non-toxic and safe, though slightly less energy-dense.
These batteries have had a meteoric rise. Last year, 50% of all EV batteries and more than 90% of stationary home and grid batteries used this chemistry.
Given world-leading battery makers now rely heavily on this chemistry, it’s likely LFP batteries will dominate the market for EV and stationary storage applications in the near term.
Many people work as creseurs – small scale miners – in the Democratic Republic of the Congo, risking their lives to extract cobalt, copper and gold.Fairphone, CC BY-NC-ND
Many next-generation batteries nearing the market are being developed for specific jobs – such as powering drones – or to outcompete current technology. Here are four new types to watch:
Sodium-ion: The world’s biggest battery maker, CATL, and other manufacturers are exploring an entirely different chemistry – sodium-ion – in a bid to eventually replace lithium-ion batteries as home or grid batteries. Sodium-ion batteries are typically heavier and less energy-dense than lithium-ion, so they wouldn’t work well in vehicles. But the chemistry has real promise for stationary energy storage.
Lithium-sulfur: These batteries rely on lithium and sulfur or sulfur-carbon composites. They can currently store four to five times more energy than traditional lithium-ion batteries, making them particularly useful for drones and other technologies where maximum power is needed. The challenge is giving them longevity, as the reactions in these batteries are harder to reverse. That means these batteries are harder to recharge many times at present. Several Australian companies are active in this space.
Solid state: Until now, lithium-ion batteries have relied on a liquid electrolyte as the medium for ions to shuttle between anode and cathode. Solid state batteries do away with the liquid, making them inherently safer. They could potentially lead to a drastic boost to energy storage. They’re not mainstream yet because it’s still tricky to get them to work at room temperature without using high pressure. If engineers figure this out, an EV using solid state batteries might travel 1,000km on a single charge.
Flow batteries: In the 1980s, Australian engineers at UNSW invented the vanadium redox flow battery. A cross between a conventional battery and a fuel cell, these typically larger batteries can feed power back to the grid for 12 hours or more, much longer than current lithium-ion battery systems.
These batteries are likely to be useful in renewable-heavy power grids. Lithium and sodium-ion batteries could provide shorter bursts of power to the grid, while flow batteries could kick in for longer periods.
So do we still need cobalt?
These developments are promising. But they don’t mean an end to cobalt entirely. Smaller amounts of cobalt will still be in the lithium-ion batteries in portable devices and EVs for the foreseeable future.
What we are likely to see is more recycled cobalt coming into the mix, as governments accelerate recycling of lithium-ion batteries and promote recycled minerals to be used in new batteries. Over time, the role of “blood cobalt” could disappear.
There is a growing number of “serious incidents” in Australian early childhood services, including day cares.
A serious incident is one that seriously compromises the health, safety or wellbeing of a child. There were 160 such incidents per 100 services in 2024–25. This is up from 148 and 139 in the previous two years.
These figures follow explosive revelations of safety issues and abuse in the sector.
In response, there are several new national child safety measures. These include banning personal phones in early childhood services, improving recruitment, and making sure parents can see a service’s compliance history.
Ratios are presented as a simple numerical safeguard to ensure enough qualified educators are present and working directly with children.
These can differ between states and territories, the type of service and the age of the children. However, for children aged under 24 months at daycare, there needs to be one educator for every four children. As children get older, the ratios change. For example, in New South Wales for children over 36 months, it is 1:10.
Tammy Williams’ recent PhD research interviewed 16 early childhood educators about their workplaces, which were a mix of for-profit services. Some were small, standalone services; others were part of large corporate chains.
They reported how ratios operate in practice can be very different from how they look on paper. This raises serious questions about how safe the system really is.
‘Under-the-roof’ ratios
The “under-the-roof” ratio is a common term in early learning services. Some services use this to calculate ratios based on the total number of children and educators across the building, rather than within each child’s regular room.
For example, an educator might have 12 children in their room instead of the regulated 1:10. But the room next door might have just eight, so on average, the ratio is met in theory. In the PhD study, one educator said:
There are times when you have two or three children over in your room, but they fit in another room, which I don’t understand. It puts so much more stress on the people in that room. I don’t even get why that is allowed.
Or educators might still be counted if they are having a break. This can be permitted in certain situations under some state regulations if the break is short and the educator is still in the same service as the children.
But media reports suggest this is overused by some services. Staff may also be counted when they are working in the office, or cleaning elsewhere in the service. Other staff, such as chefs and might also be included in the official count, even though this isn’t permitted.
As another educator noted:
Ratios, half the time, are not right […]
What are the rules?
Despite its widespread use, the term “under the roof” does not appear in the national laws or regulations. They clearly state staff counted in the ratios must be “working directly” with the children, and they must be “educators”.
So there is a mismatch between the law and how it is applied in practice. Regulators are increasing their inspections – including more unannounced visits. But regulators are also understaffed and services can go years between inspections. For planned inspections, services can “put on an act”, as one educator described.
‘There is a lot of stress’
When educators are stretched, this obviously limits their ability to provide safe, high quality education and care. In the PhD study, one educator also described how not having enough staff can lead to stress, which can flow on to the children.
I feel there is a lot of stress and […] they’re going to pick up on that and they’re going to feel it as well. I feel they miss out on things because there’s so much stuff that educators need to do.
If educators are too busy, it can also interfere with children’s relationships with educators and disrupt their daily routines and sense of security.
Despite Australia needing another 21,000 educators, educators constantly report wanting to leave, because of burnout and workplace conditions. As one interviewee explained:
The people who are passionate about being here are very, very passionate and they’re getting tired. They’re looking at moving into retail positions and cleaning positions.
What happens now?
Some flexibility when using ratios helps services adapt to unexpected day-to-day changes such as sick leave. However, the research suggests some services are using loopholes as a standard way of operating, rather than for emergencies. This leaves children at risk, without adequate supervision.
Increase staffing ratios to accommodate daily realities. These include child illness, breaks, hygiene and additional educational needs. The Productivity Commission has suggested 1:3 for babies, and we recommend 1:4 for toddlers and 1:8 for ages three to five. There also needs to be a “floater” – an educator who covers breaks and staff shortages.
Create funded cleaning and administrative positions. This would improve educators’ status and job satisfacton, allowing them to use their training to educate and care for children.
Tighten the rules. Make sure staffing rules reflect the rooms in which children belong, including only those staff actively working with the children.
Policymakers and the community rightly expect services to strengthen safety. But unchanged ratios leave educators responsible for delivering more under the same minimum staffing rules. This can lead to educator burnout and attrition. Educators need real support to ensure they are in turn, supporting children and families.
Thames Coromandel District Council is urgently asking people not to swim, fish or collect shellfish in the area around where the stream discharges until further notice.Supplied / Thames Coromandel District Council
Thames Coromandel District Council says a sinkhole has formed near the Onemana Wastewater Treatment Plant.
In a post online the council says it suspects treated wastewater may have entered a local wetland, potentially entering a stream that flows to the beach.
It says the sinkhole is on private property near the wastewater treatment plant’s subsurface irrigation field.
Onemana is a coastal community on the Coromandel Peninsula, north of Whangamata.
“As a proactive step, we are erecting signage by the Onemana Drive Carpark advising people not to swim, fish or collect shellfish in the area around where the stream discharges until further notice,” it said.
The council said it was turning off the irrigation disposal that is closest to the sinkhole, carrying out water sampling and would monitor the site to ensure no further deterioration or land movement.
This plan will decimate hotels across South Australia, wiping out many of the 26,000 jobs it directly creates.
Australian Hotels Association (South Australia) chief executive Ian Horne, quoted in The Guardian, February 21, 2018
… a majority of pub employees (over 26,000 in SA!) will likely lose their jobs.
Letter signed by the McCallum family, owners of The Lonsdale Hotel, February-March, 2018
SA Best leader Nick Xenophon has said that if his party wins the balance of power in this Saturday’s South Australian state election, poker machine reform would be “a key issue in any negotiations” about the formation of the next government.
Among other reforms, Xenophon has proposed a reduction in the number of poker machines in some pubs by 50% over five years, and the introduction of a $1 maximum bet per spin for machines in all venues other than the Adelaide casino.
The South Australian branch of the Australian Hotels Association (AHA SA), led by chief executive Ian Horne, says the SA Best policy would “decimate hotels across South Australia, wiping out many of the 26,000 jobs it directly creates”.
A letter signed and shared by the owners of one Adelaide hotel went further, saying “a majority” of 26,000 South Australian pub employees would “likely lose their jobs”.
Is that right?
Checking the source
In response to a request for sources to support the claim made in the Lonsdale Hotel letter, Keith McCallum referred The Conversation to the AHA SA.
A spokesperson for the AHA SA pointed The Conversation to a February 2018 newsletter from Ferrier Hodgson Adelaide partner David Kidman, and the ‘No Way Nick’ website, authorised by AHA SA chief executive Ian Horne.
The Conversation asked the AHA spokesperson to quantify what the association meant by “many” jobs, but did not receive a response to that question.
Verdict
The claim made by Australian Hotels Association of South Australia that proposed poker machine reforms would wipe out “many of the 26,000 jobs” in the South Australian hotel industry appears to be grossly exaggerated.
The Australian Hotels Association did not provide modelling or evidence to show how “many” jobs might be affected.
The number of gaming related jobs in South Australian hotels in 2015 was around 3,000. In the same year, less than 20% of the South Australian hotel industry’s revenue came from gaming.
The reforms proposed by SA Best aim to reduce the number of poker machines in some hotels, and reduce maximum bet limits, rather than removing the machines entirely.
Based on these factors, the Australian Hotels Association claim greatly overstates potential job losses.
In addition, at least some of the money not spent on poker machines would be spent on other recreational activities.
This means that potential job losses due to poker machine reforms may be partially offset by increases in employment elsewhere in the economy – or even within the same hotels.
What changes is SA Best proposing?
Among a suite of reforms, the SA Best party wants to reduce the number of poker machines in pubs with 10 or more machines by 10% each year over the next five years. This reduction wouldn’t apply to not-for-profit community clubs or the Adelaide Casino.
SA Best is also proposing the introduction of a $1 maximum bet per spin and a maximum win of $500 for machines in pubs and and not-for-profit community clubs.
SA Best leader Nick Xenophon said these reforms would reduce the number of poker machines in South Australia from around 12,000 to around 8,000, and reduce potential personal losses on pokies in pubs and community clubs from around $1,200 an hour to around $120 per hour.
The policy includes a poker machine buyback scheme, a “jobs fund” to assist affected employees, and the possibility of compensation for smaller poker machine operators.
Would ‘many of 26,000 jobs’ be wiped out?
First of all, let’s look at how many people work in the hotel industry in South Australia, and how many of those jobs are related to gaming.
This information is not available from the Australian Bureau of Statistics.
However, in January 2016, the South Australian Centre for Economic Studies published a report that examined the economic contribution of the hotel industry in South Australia.
The report was commissioned by the AHA SA, but it adopts a sound statistical approach to measuring employment in the hotel sector.
According to that report, a total of 26,250 staff were employed in hotels in South Australia in 2015. Of those, 3,048 were classified as gaming staff (or 11.6% of total employment).
Of the 26,250 people employed across the industry, the majority were casual staff (rather than permanent or part-time staff).
The SA Best proposal is to reduce poker machine numbers and maximum bets in some venues, as opposed to removing pokies entirely. So it’s clear that not all 3,000 gaming staff would be at risk.
However, the AHA SA is arguing that reduced revenue from pokies would threaten other jobs.
According to the same report, in 2015, 17% of the South Australian hotel industry’s annual revenue came from gaming. Around 80% of revenue came from liquor sales, food and beverage sales and accommodation.
So even in light of reduced gaming revenue, assertions that “many” or “the majority” of 26,000 pub employees would be affected appear to be unsubstantiated.
Jobs may be shifted elsewhere
To understand what might happen if Xenophon’s proposed reforms were introduced, we need to take two factors into account.
On the one hand, if less money is spent on poker machines, then the number of hours requested to service gaming activities decreases. This could result in less demand for labour, and hence a potential reduction in the number of those roles.
On the other hand, money not spent on gaming could be redirected to other recreational activities – like going to cafes, restaurants and cinemas – or to the retail sector. This would mean that new jobs would be created in other parts of the economy.
Spending diverted to food and beverage sales and other forms of entertainment could also see new jobs created within the same venues.
Another report conducted in 2006 by the South Australian Centre for Economic Studies, commissioned by the South Australian Independent Gambling Authority, found that following the introduction of electronic gaming machines in South Australia, employment in hotels did increase.
However, most of this increase came at the expense of other businesses, like cafes and restaurants. This shows that there is a strong substitution effect in employment between gaming activities and other recreational activities.
Having been published in 2006, the exact numbers in the report are dated. But the qualitative argument is unlikely to have changed. This conclusion is also supported by more recent studies.
In summary, while some of the 3,000 gaming-related jobs in the hotel industry may be lost as a result of the proposed poker machine reforms, claims that “many” or “the majority” of 26,000 jobs would be lost are grossly exaggerated, and not supported by available evidence or existing research. – Fabrizio Carmignani
Blind review
I agree with the conclusions of this FactCheck.
The assertions that “a majority” or “many” of the 26,000 jobs in the South Australian hotel industry would be lost if the proposals put forward by SA Best were to be implemented are gross exaggerations.
They might not be quite as gross an exaggeration as the analogous assertions made in Tasmania during that state’s recent election campaign, but they are an exaggeration, nonetheless. – Saul Eslake
The Conversation is fact-checking the South Australian election. If you see a ‘fact’ you’d like checked, let us know by sending a note via email, Twitter or Facebook.
The Conversation FactCheck is accredited by the International Fact-Checking Network.
The Conversation’s FactCheck unit was the first fact-checking team in Australia and one of the first worldwide to be accredited by the International Fact-Checking Network, an alliance of fact-checkers hosted at the Poynter Institute in the US. Read more here.
Have you seen a “fact” worth checking? The Conversation’s FactCheck asks academic experts to test claims and see how true they are. We then ask a second academic to review an anonymous copy of the article. You can request a check at checkit@theconversation.edu.au. Please include the statement you would like us to check, the date it was made, and a link or a photo if possible.
Labour MP Kieran McAnulty was ordered to leave the House during a tense session that included many challenges on the Speaker’s rulings.
Question Time began with Gerry Brownlee indirectly rebuking New Zealand First leader Winston Peters for his remarks towards Green MP Teanau Tuiono on Wednesday, but stopping short of demanding an apology.
The situation meant tensions did not die down in Parliament, leading to McAnulty eventually being thrown out for accusing the Speaker of double standards.
On Wednesday, Peters took issue with a question line by the Green MP, after he referred to the country as Aotearoa in his primary question.
“Why is [the minister] answering a question from someone who comes from Rarotonga to a country called New Zealand…” Peters started, before being interrupted by noise from other MPs in the debating chamber.
At the time, Brownlee said he had not heard Peters’ remark.
Peters then completed his question, asking why somebody from Rarotonga had decided “without any consultation with the New Zealand people” to change the country’s name.
In response, Brownlee said that was not an acceptable question, and it would be the last time those sorts of questions were directed “so personally” to other members.
Speaker Gerry Brownlee.VNP / Phil Smith
Tuiono has both Māori and Cook Islands Māori heritage but was born in New Zealand.
On Thursday, Brownlee stood ahead of Question Time to rule on Wednesday’s incident, and said it was “highly disorderly” to question an elected member’s rights and privileges.
“Members who engage in such comment can expect to be ejected from the House. Such comments are not only disrespectful to the member concerned, but also to this House, and also disrespectful to the electors in the electoral process that allows members to sit in this House.”
While Brownlee said he undertook his review to Peters’ question, he did not refer to Peters directly in his ruling.
On Thursday, he again pointed members to that ruling.
“I would encourage members unfamiliar with it to become familiar with it. Further questioning of the ruling will be considered highly disorderly, with the usual consequences.”
In a lengthy back-and-forth, Labour MPs took issue with Brownlee’s decision not to take further action against Peters, particularly as he had said members who made such comments could be ejected.
Shadow Leader of the House Kieran McAnulty said at the very least, Peters should have been made to withdraw and apologise.
“In August last year, you required Chlöe Swarbrick to withdraw and apologise for comments that were made on the day prior. Now, at the time we expressed concern about that, because we felt in doing so, that was setting a precedent,” McAnulty said.
“But nevertheless, here we are again in a situation where you are saying that you are unable to require a member to withdraw and apologise for something that happened yesterday.”
McAnulty said it ran the risk of applying different standards to some but not others, a point Brownlee accepted, and said he would avoid in the future.
Labour MP Willie Jackson said he took “personal offence” to Peters’ comments, to which Brownlee asked why he did not raise that at the time.
Swarbrick also encouraged the Speaker to apply the same consistency, “lest you be accused of double standards”, a comment Brownlee said was “borderline trifling” with the chair.
Green MP Ricardo Menéndez March pursued a different line of questioning, relating to Peters’ assertion that Tuiono was from Rarotonga.
“Unless the former deputy prime minister was deliberately trying to mislead the House, I think a correction should be an order, because there was a factually incorrect statement being made about where he was born.”
Brownlee said Menéndez March was making a suggestion there had been a breach of privilege, and there were processes for dealing with that.
Eventually, Brownlee called the matter to a close, and Question Time began, but the matter was not settled for the opposition.
After Brownlee chastised Jackson for repeated interruptions, McAnulty raised a further point of order.
“It’s quite clear that Willie Jackson is on a warning that if he interrupts you again he’ll be sent out,” McAnulty began.
“No it’s not,” Brownlee said.
“OK, so he can carry on?” replied McAnulty, to which Brownlee warned him he would be trifling with the chair if he carried on.
“I’m concerned that just by that statement it’s quite clear that you’re saying that if I trifle with you again that I will leave, but you won’t even require someone making a racist comment to withdraw and apologise,” McAnulty said.
He was then ordered to leave the House.
Speaking on the tiles shortly afterwards, McAnulty repeated his belief the Speaker was applying double standards.
“Winston Peters is able to trifle with him, undermine him, make racist comments, make questionable comments, certainly unparliamentary comments and actions in the House, and there is no action against that,” he said.
“We challenged the Speaker today in a respectful and highly appropriate way, and yet I’m the one that gets kicked out. Proving my point, to be fair.”
He reiterated that Labour had lost confidence in the Speaker following his ruling there was no private benefit in an amendment paper that listed projects under the Fast Track bill.
Peters insisted Swarbrick’s situation was different, as she had been told to apologise and would not, and then when she came back the next day again refused to apologise.
“[McAnulty] was raising the parallel circumstance, which were not parallel,” he said.
Peters said he was not sorry for his comments towards Tuiono.
“You’re saying that we can change the name of the country without asking the New Zealand people? That’s fascist. That’s antidemocratic.”
Source: The Conversation (Au and NZ) – By Adrian Beaumont, Election Analyst (Psephologist) at The Conversation; and Honorary Associate, School of Mathematics and Statistics, The University of Melbourne
One Nation is just two points behind Labor in a Victorian state DemosAU poll, with the election in November. A federal Resolve poll has One Nation and the Coalition tied at 23% each with Labor well ahead.
The Victorian state election is in late November. A DemosAU and Premier National poll, conducted February 1–10 from a sample of 1,274, gave the Coalition 29% of the primary vote (down eight since an October DemosAU poll), Labor 23% (down three), One Nation 21% (not previously asked for), the Greens 15% (steady) and all Others 12% (down ten).
The Coalition led Labor by 53–47 after preferences, a two-point gain for the Coalition. Even if Labor fell below One Nation on primary votes, Greens preferences would boost them back ahead of One Nation.
On this poll’s results, the Coalition would be likely to win a majority of the 88 lower house seats against Labor, but One Nation would win some seats that would otherwise go to the Coalition. The result could be a Coalition government dependent on One Nation support.
Labor Premier Jacinta Allan was at net -37 favourable, with 53% giving her a negative rating and 16% positive. Liberal leader Jess Wilson was at net +3 (27% positive, 24% negative). Wilson led Allan as preferred premier by 40–31 (former Liberal leader Brad Battin had led by 40–32 in October).
Crime was rated the most important issue by 30%, followed by cost of living on 29% and housing affordability on 12%.
By the November election, Labor will have governed Victoria for the last 12 years and 23 of the last 27. An “it’s time” factor may explain some of Labor’s bad polling.
Upper house voting intentions were 28% Coalition (down two since October), 20% One Nation (up nine), 19% Labor (down two), 14% Greens (steady), 5% Legalise Cannabis (up three) and 4% Animal Justice (up one).
All 40 upper house seats will be up for election in November using eight five-member electorates by proportional representation with preferences. The Coalition and One Nation would be favoured to win a combined majority.
Also in Victoria, a byelection will be needed in Nepean after Liberal MP Sam Groth resigned. At the 2022 state election, Groth defeated Labor in Nepean by 56.4–43.6, from primary votes of 48.1% Groth, 32.6% Labor and 8.8% Greens.
Federal Liberal leadership change and Resolve poll
Last Friday Angus Taylor was elected new federal Liberal leader, defeating former leader Sussan Ley in a spill of Liberal MPs and senators by 34–17. Ley has said she will resign from parliament, setting up a byelection in her seat of Farrer.
At the 2025 federal election, Ley defeated independent Michelle Milthorpe in Farrer by 56.2–43.8. The Liberal vs Labor two-party vote in Farrer was 62.9–37.1 to Ley. Primary votes were 43.4% Ley, 20.0% Milthorpe, 15.1% Labor, 6.6% One Nation and 4.9% Greens. The Nationals are likely to contest the byelection, so the main contenders are One Nation, Milthorpe, the Liberals and the Nationals.
A national Resolve poll for Nine newspapers was conducted February 8–14 (in the days before and after the Liberal spill) from a sample of 1,800. It has been broken into a post-spill and pre-spill sample. The post-spill sample included pre-spill polling that asked how respondents would vote if Taylor replaced Ley.
A post-spill poll put the Coalition, under new leader Angus Taylor, tied with One Nation.FLAVIO BRANCALEONE/AAP
The post-spill sample gave Labor 32% of the primary vote (up two since the January Resolve poll), the Coalition 23% (down five), One Nation 23% (up five), the Greens 11% (up one), independents 6% (down one) and others 5% (down two). In the pre-spill sample, One Nation had led the Coalition by 25–20 with other parties’ support similar.
No two-party estimate was given, but applying 2025 election flows to the post-spill sample gives Labor nearly a 54–46 lead over the Coalition, a three-point gain for Labor since January.
Anthony Albanese’s net approval improved two points since January to -20, with 55% rating him poor and 35% good. In her final poll as Liberal leader, Ley’s net approval slumped 15 points to -23. Albanese led Ley as preferred PM by 38–22 (33–29 in January).
Pauline Hanson’s net likeability was +7, Liberal Andrew Hastie’s was +4, Taylor’s was +3, Nationals leader David Littleproud’s was -8 and Labor Energy Minister Chris Bowen’s was -8. On issues, 45% rated cost of living most important, with 10% for immigration.
The Liberals led Labor by 24–23 on keeping the cost of living low (29–26 in January). On economic management, there was a 26–26 tie (31–26 to the Liberals previously).
Pre-spill Morgan poll has Labor gaining
A national Morgan poll, conducted February 9–13 (before the Liberal spill) from a sample of 1,216, gave Labor 30.5% of the primary vote (up two since the February 2–8 Morgan poll), One Nation 25% (up 0.5), the Coalition 20% (down 2.5), the Greens 13% (down 0.5) and all Others 11.5% (up 0.5).
Labor led the Coalition by a blowout 58.5–41.5 on respondent preferences, a five-point gain for Labor. On 2025 election flows, Labor led by 55–45, a two-point gain for Labor. No Labor vs One Nation two-party estimate was reported.
Tasmanian DemosAU poll has Liberals down
A Tasmanian state DemosAU poll, conducted January 27 to February 12 from a sample of 1,071, gave the Liberals 35% of the primary vote (down six since an October DemosAU poll), Labor 23% (down one), independents 17% (up three), the Greens 15% (steady), the Shooters 4% (up two) and others 6% (up two). One Nation was not asked for as it is not yet a registered party in Tasmania.
Tasmania uses a proportional system so a two-party estimate is not applicable. Liberal Premier Jeremy Rockliff’s net approval slid three points to +2, while Labor leader Josh Willie’s net approval was down two points to -7. Rockliff led Willie as preferred premier by 43–32 (46–34 previously).
Other politicians listed were Liberal Treasurer Eric Abetz (-21 net approval), former Labor leader Dean Winter (-23) and Greens leader Rosalie Woodruff (-21). Winter’s net approval jumped ten points since October.
Upcoming UK byelection and US special elections
I wrote for The Poll Bludger last Thursday about a February 26 United Kingdom parliamentary byelection in a safe Labour seat and three United States federal special elections for the House of Representatives that will occur by August. Democrats are attempting to gerrymander Virginia’s 11 House districts for a 10–1 Democratic split.
South Australians head to the polls on March 21, with Premier Peter Malinauskas’s Labor Party on track to win by a landslide.
But while a predicted landslide in a state election would not normally garner deep national attention, the SA election will be closely watched this time as a microcosm of the changing dynamics of Australian politics.
The headline two-party preferred figure of 61–39% in favour of Labor is masking the broader splintering of the right side of politics. The Liberals are haemorrhaging votes to One Nation, which leads them on the primary vote by 20–19%.
Liberal woes
While the federal Liberals are suffering from leadership and coalition instability, the SA branch has its own systemic problems. The state Liberals have been a party of almost perpetual opposition, only forming government when Labor is plagued by scandal and longevity in office. The Liberals have only won five elections out of 17 since 1965.
SA does not have a coalition, as the Liberal and Country parties merged in 1932. There has been only sporadic Nationals representation in parliament, with the most recent Nationals MP, Karlene Maywald, controversially serving in the Rann Labor Cabinet from 2004–10.
Geography is a major contributor to Liberal electoral woes, with much of their vote traditionally being concentrated in rural and regional seats. One Nation is running candidates in all lower house seats, and would be most hopeful of picking up some of the more regional Liberal seats, such Hammond. Six of the Liberals’ 13 current seats might be under threat, along with two or three of the crossbench seats such as Mount Gambier.
More pointedly, the party has also long been bedevilled by factional infighting and the regular defection of rural members to the crossbench. These rural defectors have demonstrated an ability to “dig in” across usually safe Liberal seats. Rural and regional MPs disproportionately dominate the Liberal caucus, which skews its ability to appeal to more metropolitan seats.
The Liberals are suffering from leadership churn. Liberal leader Ashton Hurn, who was a media advisor to former Liberal Premier Steven Marshall, took over from Vincent Tarzia in December 2025. Tarzia had only served as leader since August 2024, having taken over from David Speirs, who was convicted for supplying a controlled substance.
Under this tumult, Labor consolidated its lead by picking up two crucial byelection wins in Dunstan and Black. The Liberals currently hold a nominal 13 of the 47 seats in the lower House – a record low. Current polling indicates they will lose more seats at the March election, and there is even a chance they will be left without a single lower house MP.
Opposition leader Ashton Kurn has been in the job since December 2025, and faces a monumental task at the state election.Abe Maddison/AAP
One Nation and the far right in SA
One Nation is a late entrant to SA politics, and has only elected one member, Sarah Game, to the Legislative Council in 2022. One Nation has historically been organisationally weak in the state – it even failed to register its candidates in time for the 2018 state election. Game subsequently resigned from the party in late 2025, following a preselection dispute with Hanson – a common occurrence in One Nation’s history.
Hanson recently announced former senator Cory Bernardi would head the party’s upper house ticket in 2026.
Bernardi served as a Liberal senator for SA in 2006–17, before forming the short-lived Australian Conservatives party between 2017–19. Sharing a similar Christian Conservative values base, the party merged with the pre-existing Family First party – a morality-focused conservative party with an enduring presence in SA politics.
Bernardi is a polarising figure with lower popularity in the state than Hanson. So there is a question about whether his conservative credentials will add to One Nation’s electoral support.
One Nation’s prospects
The election campaign to date has been relatively uncontroversial, despite lingering issues of ambulance ramping, the algal bloom and the cancellation of the Adelaide Writer’s Week being potential weaknesses for the government. Malinauskas and Labor have been emphasising their “building” credentials, pointing to major infrastructure projects such as the North-South Corridor, and promising significant urban expansion.
Campaign activity has tended to be focused in Liberal-held seats. These range from urban marginals such as Morialta, Unley and Colton to usually more secure regional areas such as Ngadjuri, Hammond and Kavel, which are being encroached on by Adelaide’s urban sprawl.
The Liberals are struggling to offer a policy narrative. For example, there is confusion over their signature stamp duty policy, which has changed in the switch from Tarzia to Hurn.
The electoral conditions seem ideal for a One Nation surge. However, there are reasons to temper expectations. One Nation tends to poll most strongly in rural seats. Several rural electorates in SA already have independent incumbents, or high-profile independent candidates who have been in the field for months. This may complicate One Nation’s path to victory in these areas.
Crisis on the centre-right
The Malinauskas government is poised for an emphatic win on election night. Yet, the foundations of the results are grounded less in Labor’s policy record than in the deepening crisis of the centre-right in Australia.
In common with countries such as the United Kingdom, France, Sweden and Germany, there is a growing fragmentation of the right. A recent academic study of state politics shows how these dynamics play out in very specific and localised ways in Australia.
At the heart of this is an ideological splintering, with a more assertive conservative politics increasingly at odds with the more socially liberal but economically classical traditions. The SA result may offer insight into how deep this fracture is.
Source: The Conversation (Au and NZ) – By Kelsie Boulton, Senior Research Fellow in Child Neurodevelopment, Brain and Mind Centre, University of Sydney
When it comes to autism, few questions spark as much debate as how best to support autistic people with the greatest needs.
This prompted The Lancet medical journal to commission a group of international experts to propose a new category of “profound autism”.
This category describes autistic people who have little or no language (spoken, written, signed or via a communication device), who have an IQ of less than 50, and who require 24-hour supervision and support.
It would only apply to children aged eight and over, when their cognitive and communication abilities are considered more stable.
In our new study, we considered how the category could impact autism assessments. We found 24% of autistic children met, or were at risk of meeting, the criteria for profound autism.
Why the debate?
The category is intended to help governments and service providers plan and deliver supports, so autistic people with the highest needs aren’t overlooked. It also aims to re-balance their under-representation in mainstream autism research.
This new category may be helpful for advocating for a greater level of support, research and evidence for this group.
But some have raised concerns that autistic people who don’t fit into this category could be perceived as less in need and excluded from services and funding supports.
Others argue the category doesn’t sufficiently emphasise autistic people’s strengths and capabilities, and places too much emphasis on the challenges that are experienced.
What did we do?
We conducted the first Australian study to examine how the “profound autism” category might apply to children attending publicly funded diagnostic services for developmental conditions.
Drawing on the Australian Child Neurodevelopment Registry, we examined data from 513 autistic children assessed between 2019 and 2024. We asked:
how many children met the criteria for profound autism?
were there behavioural features that set this group apart?
Because we focused on children at the time of diagnosis, most (91%) were aged under eight years. We described these children as being “at risk of profound autism”.
What did we find?
Around 24% of autistic children in our study met, or were at risk of meeting, the criteria for profound autism. This is similar to the proportion of children internationally.
Almost half (49.6%) showed behaviours that were a safety risk, such as attempting to run away from carers, compared with one-third (31.2%) of other autistic children.
These challenges weren’t limited to children who met criteria for profound autism. Around one in five autistic children (22.5%) engaged in self-injury, and more than one-third (38.2%) showed aggression toward others.
So, while the category identified many children with very high needs, other children who didn’t meet these criteria also had significant needs.
Importantly, we found the definition of “profound autism” doesn’t always line up with the official diagnostic levels which determine the level of support and NDIS funding children receive.
In our study, 8% of children at risk of profound autism were classified as level 2, rather than level 3 (the highest level of support). Meanwhile, 17% of children classified as level 3 did not meet criteria for profound autism.
Our concern
We looked at children when they first received an autism diagnosis. Children were aged 18 months to 16 years, with more than 90% under the age of eight years.
This aligns with our earlier research, showing the average age of diagnosis in public settings is 6.6 years.
From a practical perspective, our biggest concern about the profound autism category is the age threshold of eight years.
Because most children are already assessed before age eight, introducing this category into assessment services would mean many families would need repeat assessments, placing additional strain on already stretched developmental services.
Second, modifications will be needed if this criteria is going to be used to inform funding decisions as it didn’t map perfectly onto level 3 support criteria.
On balance, however, our results suggest the profound autism category may provide a clear, measurable way to describe the needs of autistic people with the highest support requirements.
Every autistic child has individual strengths and needs. The term “profound autism” would need to be promoted with inclusive and supportive language, so as to not replace or diminish individual needs, but to help clinicians tailor supports and obtain additional resources when needed.
If you’re concerned your child requires substantial support, here are some practical steps you can take to ensure their needs are recognised and addressed:
Explain your concerns
Not all clinicians have experience working with children with high support needs. Be as clear as possible about behaviours that affect your child’s safety or daily life, including self-injury, aggression or attempts to run away. These details, while difficult to share, help give a clearer picture of your child’s support needs.
It can also be a challenge to find and access clinicians with appropriate expertise. Another potential benefit of having a defined category is that it can better help families navigate care.
Ask about support for the whole family
Our studies show that many caregivers want more support for themselves but don’t always ask. Talk with clinicians about supports for yourself as well, including respite, or family support groups.
Reach out
Coming together with other carers and families can reduce your own isolation and normalise many of the unique challenges you face. Connecting with like-minded people can provide a supportive, empathetic and empowering community.
Plan for safety
For children with high support needs, prioritise safety planning with your child’s care team. This can include strategies to reduce risks, as well as planning how best to support your child’s interactions with health, education and disability services over time.
The Conversation fact-checks claims made on Q&A, broadcast Mondays on the ABC at 9.35pm. Thank you to everyone who sent us quotes for checking via Twitter using the hashtags #FactCheck and #QandA, on Facebook or by email.
Excerpt from Q&A, April 23, 2018.
What’s incredible when you look at those numbers is about 30% – it’s hard to tell often – about 30% of those homeless people have a job.
– Rebecca Huntley, social researcher and author, speaking on Q&A, April 23, 2018
Inequality, class and social mobility in Australia were key issues discussed on a recent episode of Q&A.
Social researcher and author Rebecca Huntley noted an uptick in the idea of “the undeserving poor” in Australia – particularly where homeless people are concerned.
Huntley noted the perception held by some that homeless Australians are simply “not working hard enough”.
Challenging that narrative, Huntley said “about 30% of those homeless people have a job”.
The definition of homelessness in the Census is probably broader than community perceptions about homelessness – that is, that all homeless people are sleeping rough on the streets.
People who are couch surfing or living in their car or living in overcrowded accommodation may well fit into this definition. They may also be working in the gig economy or getting work here and there (the double whammy of insecure work and insecure housing is quite terrible).
What the Census 2016 data show is that there are people with post compulsory education, with various levels of work and hours worked across all categories of people living in insecure housing arrangements.
Verdict
Based on the best available data, Rebecca Huntley’s statement that “about 30% of … homeless people have a job” is correct.
According to Census 2016 data, about 30% of people who were recorded as being homeless on Census night (using the Australian Bureau of Statistics definition of homeless) were also recorded as being in the work force.
What does it mean to be ‘homeless’?
When we talk about “homelessness”, many of us would think about people “sleeping rough” on the street. This is arguably the most severe and literal form of homelessness. But the state of being homeless is more complex than that.
Under the Australian Bureau of Statistics (ABS) definition, a person can be considered homeless if their current living arrangement:
is in a dwelling that is inadequate
has no tenure, or if their initial tenure is short and not extendable, or
does not allow them to have control of, and access to space for social relations.
The ABS presents its estimates of homelessness using these groupings:
People living in improvised dwellings, tents or sleeping out
People in supported accommodation for the homeless
People staying temporarily with other households
People living in boarding houses
People in other temporary lodgings, and
People living in “severely” crowded dwellings.
On the night of the 2016 Census, more than 116,000 people were counted as being homeless. This includes both children and adults. The estimates of the employment rate include only those age 15 and over.
This may be a conservative count, because some groups of people may be underenumerated (under counted) in the Census.
For example, the ABS notes that Aboriginal and Torres Strait Islander peoples’ are “more likely to be both underenumerated and over represented in the homeless population”, and that:
So called rough sleepers and people staying in supported accommodation for the homeless are also at risk of being underenumerated in the Census.
What constitutes ‘a job’?
In the Census data, people are counted as being employed if they are of working age (age 15 and over) and:
employed and working full-time
employed and working part-time, and/or
employed but away from work.
However, not all people age 15 and over who were experiencing homelessness were counted in the Census labour force statistics. For some people, no information was recorded.
Known employment rates for homeless people
If we calculate the known employment rate for homeless people (using the ABS definition of homelessness outlined above), we find that around 30% are employed, as Rebecca Huntley said on Q&A.
But the employment rate among homeless people could be higher.
That’s because we don’t have employment information for all homeless people. In the Census statistics, there are large numbers of people for whom information on employment status is missing, or not stated.
Overall, we don’t have records of the employment status of about 18% of the total homeless population.
Also, many people experiencing homelessness could be in situations where they wouldn’t be expected to work. For example, full-time students or the elderly.
This makes 30% likely to be the lower bound.
If we assume that the employment rate of those with missing information is the same as those with recorded information, the employment rate would increase to 36%. If we also excluded full-time students and the elderly from these statistics, the rate would be even higher.
Employment rate for people ‘sleeping rough’
“Sleeping rough”, or sleeping on the street, is arguably the most severe form of homelessness.
People sleeping rough are the group with the highest proportion of missing information on labour force status. The known employment rate for people sleeping rough is 10%.
If about half of the people with missing information were employed, the rate would go up to 30%. My assumption for this group is that most of those people with missing information are not employed.
So for those sleeping rough, the employment rate is probably closer to 10-15%.
The employment rate for people in supported accommodation is also likely to be around 10-15%. These two groups are those usually considered when a more literal definition of homelessness is used.
But as outlined in this FactCheck, the state of being “homeless” is more complex and wide ranging than that.
‘Journeys Home’ survey
Another useful data set on homelessness and employment is the Melbourne Institute’s Journeys Home survey, of which I was the Deputy Director.
This longitudinal survey, which began in 2011 and concluded in 2014, included 1,682 people in Australia flagged by Centrelink as either “homeless” or “at-risk of homelessness”.
The survey also included a group of income support recipients who were not flagged as homeless, but who had characteristics similar to those who had been homeless.
The overall rate of employment among all respondents was 27%. Of those who were homeless, 19% were employed.
In our study, however, we did not include those in overcrowded accommodation as being homeless. (These people are identified as being homeless in the Census).
This highlights the importance of the definition of “homelessness” used when considering the characteristics of the homeless population.
It’s also important to remember that just because someone isn’t employed doesn’t mean they don’t want to be employed, or aren’t seeking employment. Being homeless is a significant barrier to gaining – and retaining – a job. – Rosanna Scutella
Blind review
I agree with the verdict of this FactCheck that the overall rate of employment among people experiencing or being at-risk of homelessness is in the vicinity of 30%.
I would add that findings from my research using the Journeys Home data reveal that homelessness is more strongly associated with difficulty in retaining employment than with finding employment. – Neha Swami
The Conversation FactCheck is accredited by the International Fact-Checking Network.
The Conversation’s FactCheck unit was the first fact-checking team in Australia and one of the first worldwide to be accredited by the International Fact-Checking Network, an alliance of fact-checkers hosted at the Poynter Institute in the US. Read more here.
Have you seen a “fact” worth checking? The Conversation’s FactCheck asks academic experts to test claims and see how true they are. We then ask a second academic to review an anonymous copy of the article. You can request a check at checkit@theconversation.edu.au. Please include the statement you would like us to check, the date it was made, and a link if possible.
Source: The Conversation (Au and NZ) – By Samara McPhedran, Senior Research Fellow, Violence Research and Prevention Program, Griffith University
… the leading preventable cause of death and illness for women aged 18 to 44 is violence by a partner or former partner …
– Extract from an editorial in The Age, March 13, 2018
The latest available data shows that the top five causes of death, disability and illness combined for Australian women aged 15-44 years are anxiety and depression, migraine, type 2 diabetes, asthma and schizophrenia.
Violence (let alone the subset of family violence) doesn’t make the list.
– Statement published on the One in Three Campaign website, March 2018
Violence within intimate and domestic relationships in Australia is a serious social problem that has devastating consequences.
The statement that intimate partner violence or family violence is the leading preventable cause of death and illness for women aged between 15 (or 18) to 44, has been quoted by numerousmedia outlets and advocacy groups.
But the One in Three Campaign, an advocacy group focused on the male victims of family violence, says these statistics are misleading.
Who is correct?
Checking the sources
In response to The Conversation’s request for sources, a spokesperson for The Age pointed The Conversation to the website of the Victorian health promotion agency, VicHealth.
Australia’s National Research Organisation for Women’s Safety (ANROWS) did a follow-up report in 2016 using similar methodology, but on a national scale. The ANROWS report focuses on Australian women aged 18 to 44, which corresponds to The Age’s statement.
You can read the full response from The One in Three Campaign here.
Verdict
The Age editorial used the words “leading preventable cause of death and illness for women aged 18 to 44”. This is incorrect.
It’s important to make a distinction between cause and contributor to death and illness.
If The Age editorial used the words “contributor to”, it would be correct, i.e. “leading preventable contributor to death and illness for women aged 18 to 44”.
The findings, however, did not change a great deal between the 2003 and 2011 Australian Burden of Disease reports, in terms of the top causes of death, injury and illness.
If One in Three used the words “previous and current data shows”, and updated its reference, the claim would be correct.
While both of these claims are close to being correct, neither is complete.
Cause versus contributor
To give the full picture of how domestic violence is related to death, injury and illness, we need to look at causes of death, injury and illness, and the contributors to those causes.
If we were talking about lung disease, for instance, we would treat that as a “cause” of illness, but we would also consider whether a person was a heavy smoker (a contributor).
Likewise, if we were to look at the number of people whose deaths were due to type 2 diabetes (the cause), we would be interested in knowing whether those people had an unhealthy diet (a contributor).
Intimate partner violence can be treated as either a cause of death, injury and illness in its own right (as a subset of violence), or a contributor to other causes, such as depression and anxiety.
Intimate partner violence can be a leading contributor to death, injury and illness among women, without being among the leading causes. Looking at it from one perspective alone doesn’t provide a complete picture.
The claim by the One in Three Campaign is based on the AIHW Australian Burden of Disease Study 2003. This looks at the burden of death, injury and illness for all Australians, as well as providing breakdowns by age and sex.
The 2003 AIHW report is not the latest available data but the more recent Australian Burden of Disease Study 2011 contains basically the same results, in terms of the top causes of death, injury and illness.
The report used a range of data sources to look at different types of death, injury and illness, and considered how each of those contributed to the total “burden of disease”.
The “burden of disease” is based on a calculation of the number of years lost across a specified population due to premature death and years of “healthy” life lost due to disability arising from injury or illness. These years are called “disability-adjusted life years”.
According to that report, intimate partner violence was not among the top causes of death for women. Homicide and violence is the 26th highest cause of death, disability and illness.
The One in Three Campaign talked about the top five causes of death, disability and illness. The illnesses they referred to were the leading causes of “disability-adjusted life years”.
So this claim is about intimate partner violence as a cause of death, injury and illness rather than as a contributor to other causes.
It is important to note, however, that the 2003 AIHW report also estimated the contribution of intimate partner violence to the development of burdens such as depression and anxiety.
The report found intimate partner violence to be a leading risk for the development of depression and anxiety.
contributes more to the [disease] burden than any other risk factor in women aged 18-44 years, more than well known risk factors like tobacco use, high cholesterol or use of illicit drugs.
The ANROWS report draws very strongly on methods and data used in the AIHW Australian Burden of Disease Study 2011, and focuses on intimate partner violence victimisation as a risk factor for death and other outcomes, such as mental and physical illness.
In other words, The Age claim is based on a report looking at the contribution of intimate partner violence to other causes of death, injury and illness – rather than as a cause in itself.
The report suggests intimate partner violence contributes to around 5.1% of the total “burden of disease” among women aged 18-44, making it the largest single contributor to the “burden of disease” for that group of women.
The estimates reported are generally similar to other estimates (including those provided by AIHW reports) in terms of the magnitude of the burden, the diseases contributing to it and its ranking among other risk factors.
However, they may be slightly different due to the ANROWS report using a broad definition of intimate partner violence which includes emotional, as well as physical, abuse.
Both claims rest on information drawn from very similar sources: the AIHW Burden of Disease Study 2011 and the previous study from 2003. Although all datasets and methods come with caveats and cautions, there is no reason to believe that those sources are inaccurate.
The inconsistency between the claims arises from different ways of looking at the question, and different interpretations of essentially the same data.
Based on the reports above, a more accurate thing to say is that although intimate partner violence is not a leading cause of death, injury and illness among Australian women aged 18-44, it does appear to be a leading contributor. – Samara MacPhedran
Blind review
I agree with the conclusions of this FactCheck. It is a balanced examination of the alternative claims about the impact of domestic violence on women’s health, and highlights the differences in the direct claims of causation, as against the more indirect claims of contribution.
The FactCheck also rightly highlights that the definition of domestic violence has been expanded widely to move beyond physical violence, to capture more abstract forms such as emotional, psychological and financial abuse. – Terry Goldsworthy
* This article has been updated after publication to clarify the data in the first chart.
The Conversation FactCheck is accredited by the International Fact-Checking Network.
The Conversation’s FactCheck unit is the first fact-checking team in Australia and one of the first worldwide to be accredited by the International Fact-Checking Network, an alliance of fact-checkers hosted at the Poynter Institute in the US. Read more here.
Have you seen a “fact” worth checking? The Conversation’s FactCheck asks academic experts to test claims and see how true they are. We then ask a second academic to review an anonymous copy of the article. You can request a check at checkit@theconversation.edu.au. Please include the statement you would like us to check, the date it was made, and a link if possible.
Source: The Conversation (Au and NZ) – By Dylan McConnell, Researcher at the Australian German Climate and Energy College, The University of Melbourne
The Conversation fact-checks claims made on Q&A, broadcast Mondays on the ABC at 9.35pm. Thank you to everyone who sent us quotes for checking via Twitter using hashtags #FactCheck and #QandA, on Facebook or by email.
Excerpt from Q&A, March 19, 2018.
Now, the consequence of [Jay Weatherill’s] policies was that South Australians faced the highest electricity charges, the highest retail electricity charges, in the country.
– Minister for Urban Infrastructure and Cities Paul Fletcher, speaking on Q&A, March 19, 2018
During an episode of Q&A, Minister for Urban Infrastructure and Cities Paul Fletcher said that South Australia has the “highest retail electricity charges in the country”. That statement in itself is correct.
But Fletcher went on to say that the high prices were “the consequence” of former SA Premier Jay Weatherill’s renewable energy policies, which included the introduction of a 50% renewable energy target, met in 2017.
Was Fletcher right?
Checking the source
In response to a request for sources and comment, a spokesperson for Fletcher pointed The Conversation to the Australian Energy Market Commission’s 2017 Residential Electricity Price Trends report, wholesale electricity price data from the Australian Energy Market Operator, and a 2017 Australian Competition and Consumer Commission report, which stated that:
… the combination of significant network investment over the past decade, recent increases to gas prices, more concentrated wholesale markets, and the transition from large scale synchronous generation to variable and intermittent renewable energy resources has had a more pronounced effect on retail prices and number of offers in South Australia than any other state in the National Electricity Market.
You can read the full response from Fletcher’s office here.
Verdict
Paul Fletcher was correct to say that South Australia has the highest retail electricity prices in Australia.
Current prices for the typical South Australian customer are 37.79 cents per kilowatt-hour (c/kWh). The Australian Capital Territory has the lowest retail electricity prices in Australia, at around 23.68 c/kWh.
But there are many factors that affect retail electricity prices. Increasing levels of renewable energy generation is just one.
Other factors include network costs, gas prices, changes in supply and demand dynamics and market competition issues.
Therefore, Fletcher’s assertion that South Australia’s high retail electricity prices are “the consequence” of former Premier Jay Weatherill’s renewable energy policies is incorrect.
Does South Australia have the highest retail electricity prices in the nation?
First, a quick terminology reminder. “Energy” is a broad term that includes sources such as petrol, diesel, gas and renewables, among other things. “Electricity” is a specific form of energy that can be produced from many different sources.
The “retail electricity price” is what you’ll typically see in your home electricity bill, and is usually expressed in cents per kilowatt-hour (c/kWh).
According the Australian Energy Market 2017 Residential Electricity Price Trends report, South Australia does indeed have the highest retail prices in the nation. Current prices for the typical South Australian customer are 37.79c/kWh.
The lowest retail electricity prices in the country are in the Australian Capital Territory, where the typical customer pays around 23.68c/kWh.
The retail electricity price includes the wholesale price of the electricity, the network costs (or the “poles and wires” that bring the electricity to your home), retailing costs, and levies related to “green schemes” (such as the renewable energy target or solar feed-in tariffs).
The chart below shows how the different components contributed the electricity price increase in South Australia between 2007-08 and 2015-16.
For many years the drivers for retail prices have been network costs – which have very little to do with renewables.
But over the past 18 months, there has also been a increase in wholesale electricity prices across the entire National Electricity Market – the interconnected power system that covers Queensland, New South Wales, the Australian Capital Territory, Victoria, South Australia and Tasmania.
A range of factors have contributed to this.
These include the increase in gas prices, and the tightening of the supply-demand balance.
The ACCC is also investigating “transfer pricing” – which is when a business that’s an energy generator as well as a retailer shifts costs from one part of its business to another.
Are the prices ‘the consequence’ of Weatherill’s renewable energy policy?
No. Even if wholesale prices become the main driver of retail prices, it’s not accurate to place the blame squarely on renewables.
Increased renewable energy generation may have contributed to decisions for some power plants to close. But so would other factors – such the A$400 million safety upgrade required for the Hazelwood power plant to have stayed open.
As mentioned above, other factors such as gas prices and competition issues have also contributed to increases in wholesale electricity prices. And as shown below, these are not confined to South Australia.
So, Fletcher was not correct to say that South Australia’s high electricity prices are “the consequence” of Weatherill’s renewable energy policies.
Indeed, a large proportion of the existing renewable investment in South Australia has been financed as a result of the federal Renewable Energy Target, introduced by the Howard government, rather than state policy. – Dylan McConnell
Blind review
I agree with the verdict.
The price question is not contentious. South Australia has the highest retail electricity prices in Australia.
But no single factor or decision is responsible for the electricity prices we endure today.
The Conversation FactCheck is accredited by the International Fact-Checking Network.
The Conversation’s FactCheck unit was the first fact-checking team in Australia and one of the first worldwide to be accredited by the International Fact-Checking Network, an alliance of fact-checkers hosted at the Poynter Institute in the US. Read more here.
Have you seen a “fact” worth checking? The Conversation’s FactCheck asks academic experts to test claims and see how true they are. We then ask a second academic to review an anonymous copy of the article. You can request a check at checkit@theconversation.edu.au. Please include the statement you would like us to check, the date it was made, and a link if possible.
Source: The Conversation (Au and NZ) – By Helen Barrie, Deputy Director of the Australian Migration and Population Research Centre, University of Adelaide
Nick Xenophon: The key issue here – and what I find most galling and emblematic of what is wrong – is we now have fewer young people in South Australia than we did 36 years ago, when our population was 400,000 fewer.
Jay Weatherill: And Nick – you’ve done it before. You’ve said that there are fewer young people here than there were in 1982. You know what you need to do to actually reach that conclusion?
You take the high point in 1981 – it falls all the way to 2002. Since 2002 to now, it’s grown by 36,000.
Sure, it’s less than 1981-82 now, but you have to ignore the fact that, under the entire life of this government, it has actually grown, the number of young people has grown.
– SA Best leader Nick Xenophon and Premier Jay Weatherill, speaking at the SA Votes: Leaders’ Debate, Adelaide, March 5, 2018
In a leaders’ debate ahead of the South Australian election, Premier Jay Weatherill and SA Best leader Nick Xenophon disagreed over the extent to which young people were leaving the state in search of better opportunities.
Xenophon claimed that “we now have fewer young people in South Australia than we did 36 years ago, when our population was 400,000 fewer”.
Weatherill agreed that there are fewer young people in South Australia now than there were in 1981-82, but said that in quoting that figure, Xenophon had ignored “the fact that, under the entire life of this [Labor] government … the number of young people has grown”.
Were the leaders right? And what’s behind these trends?
Checking the sources
In response to a request for sources and comment, a spokesperson for Xenophon pointed The Conversation to the 2017 Deloitte report Shaping Future Cities: Make it big Adelaide, which states:
Fewer people aged between 15 and 34 live in South Australia today than in the mid-1980s, despite the fact that the population has increased by around 340,000 people in that time.
The claim Xenophon made during the debate echoed a quote from an SA Best policy document, which states that there are “fewer young people – 18-to-34 year olds – living in South Australia today than 35 years ago”, and that this is “emblematic of the state’s decline”. So we’ll take 18-34 as Xenophon’s reference point.
A spokesperson for Jay Weatherill referred The Conversation to a 2018 report from the South Australian Centre for Economic Studies, and pointed to Australian Bureau of Statistics data showing that in the 0-24 age group, there was a decrease of 53,395 people between 1982 and 2002, followed by an increase of 36,742 people between 2002 (when Labor was returned to office under) and June 2017.
You can read the full response from Weatherill’s spokesperson here.
Verdict
During a South Australian leaders’ debate, SA Best leader Nick Xenophon and Premier Jay Weatherill provided different narratives about youth population trends.
Xenophon said “we now have fewer young people in South Australia than we did 36 years ago, when our population was 400,000 fewer” – a statistic he said was “emblematic” of employment issues in the state.
Both leaders used different definitions of “young people”.
Using SA Best’s own definition, Xenophon was incorrect. There were more people aged 18 to 34 in South Australia in 1982 than today. However, based on Weatherill’s definition (people 0 to 24 years), and another relevant definition (people 15 to 24 years), Xenophon’s statement is correct.
Weatherill was correct to say that since 2002, “under the entire life of this [Labor] government … the number of young people has grown”.
The proportion of young people in South Australia’s total population (across all three definitions) has declined since the early 1980s, but the decline has slowed since 2002.
However, none of the numbers are a simple reflection of the failure or success of government policies. There are also a number of longer term economic and social trends at play.
How do we define ‘young people’?
There’s no single definition of “young people” – and as you would expect, different definitions provide different outcomes.
During the campaign, the relevant policy document from Xenophon’s SA Best party described “young people” as being between the ages of 18 and 34.
Weatherill used a definition of young people as those aged between 0 and 24. (Keeping in mind that young people aged 0-17 are unlikely to leave the state of their own accord).
Each leader chose to highlight the numbers that best supported their own narrative.
Another way of examining this issue is to look at young people aged 15-24.
This is an age when many young people become independent, and may move away from South Australia to finish their education or find employment.
So here are the age ranges we’ll be looking at:
0-24 year olds (Weatherill’s definition)
15-24 year olds (highly mobile demographic), and
18-34 year olds (Xenophon’s definition).
Did the leaders quote their numbers correctly?
Xenophon said “we now have fewer young people in South Australia than we did 36 years ago, when our population was 400,000 fewer”.
According to Census data, South Australia’s population in 1981 was 1,285,042. In 2016, the Census recorded 1,676,653 people – a difference of 391,611.
Given that Xenophon was speaking in a live debate, rounding this number up to 400,000 is understandable.
In 1982, there were around 378,000 people aged 18-34 in South Australia, compared to just over 390,000 in 2017. In terms of raw numbers, that’s an increase of around 12,000 people. So on those calculations (using his own definition), Xenophon was incorrect.
However, based on the numbers for 0 to 24 year olds (Weatherill’s definition), and 15 to 24 year olds, Xenophon’s statement is correct.
The proportion of 18-34 year olds also fell from around 28% of the total population in 1982, to around about 23% in 2017.
Do Weatherill’s numbers stack up?
Weatherill pointed to 1981 as being a “high point” in youth population in South Australia.
It’s true that in the early 1980s, youth population numbers and youth as a proportion of the total population were higher.
It’s also true that the raw numbers of young people in South Australia then declined until the early 2000s. As the first chart in this FactCheck shows, after 2002 there was growth in the numbers of young people across all three definitions.
(Labor was returned to office in 2002, led by Mike Rann. Weatherill became premier in 2011.)
So, in terms of raw population numbers, Weatherill was correct to say that “under the entire life of this government … the number of young people has grown”.
Using Weatherill’s own definition (0-24 year olds), there was an increase of 36,742 people (in line with his original quote of 36,000).
The proportion of young people across all three definitions has declined since the early 1980s (though that decline has slowed since 2002).
Interestingly, as the chart shows, the decline in the proportion of 0-24 year olds has been greater than the proportions of the 15-24 and 18-34 cohorts, which have stayed relatively static under the four terms of the Labor government.
This is where the numbers tell us a new story – the biggest decline has been in the proportion of younger children. This suggests that falling fertility rates may have been a driver.
As you can see from the chart below, total fertility rates in South Australia did fall between 2008 and 2016.
What’s driving these trends?
The leaders were discussing these numbers in the context of the viability of South Australia as a place where young people can find work and affordable housing, and preventing the so-called “brain drain” that occurs when young people leave the state in search of opportunities elsewhere.
During the debate, Xenophon (and SA Liberal leader Steven Marshall) painted a picture of increasing numbers of young people leaving South Australia, while Weatherill told the story of youth population growth “under the entire life of this [Labor] government”.
None of the numbers are a simple reflection of the failure or success of government policies that may help to retain youth populations. There are larger historical trends at play.
Understanding the ‘Baby Boomer’ effect
We cannot fully understand why South Australia had more young people in the 1980s and 1990s than it does today without looking back to the postwar period of 1946 to 1964 – the years when the “Baby Boomer” generation was born.
The baby boom was particularly pronounced in South Australia, and coincided with a strong manufacturing sector that attracted young people from other states, and migrants during a period of high immigration rates (migrants also tend to be young).
This convergence meant that the early 1980s was a unique time in South Australian population trends.
The first wave of the Baby Boomers (born in the late 1940s and early 1950s) were having children, and those children would have been counted in the 1981 Census. At the same time, the late cohort of Baby Boomers (those born in the late 1950s and 1960s) would still have been included in the 20-24 year old Census cohort.
This was followed by a “baby bust”, or falling fertility rate. From a peak in the early 1960s, family sizes declined, reflecting national trends.
Economic factors are also at play
A number of economic events that took place in the early 1990s also had an impact on South Australia’s population profile.
A 2018 report published by the South Australian Centre for Economic Studies (SACES) noted that, in addition to the national recession, South Australia was affected by:
the loss of headquartered companies around the same time, and
the loss of “mass manufacturing” employment, which began in the 1980s and accelerated in the early 1990s.
The SACES report found that between 1993-94 and 2001-02, South Australia’s population growth was affected by “sharply reduced overseas immigration and increased outward migration to interstate”. The authors added that:
The dominant cohorts of those who left South Australia were young people and young families.
They did not return and they married and/or had children adding to other states’ younger aged profile while depleting our own.
It would be interesting to see how the numbers of international students in South Australia affect the composition of youth populations. People on student visas who are residents of South Australia are captured in Census data, but the data we need to properly analyse this factor are not readily available. – Helen Barrie
Blind review
The author offers a sound consideration of the available evidence.
The proportion of young people in South Australia has declined since the early 1980s – whether defined as those aged 0-24, 15-24, or 18-34 years.
Despite the decline in the proportion of young people, population momentum means that the South Australian population is still growing, albeit not as strongly as the Australian population overall. – Liz Allen
The Conversation thanks Liz Allen for providing the data used to create the charts in this FactCheck.
The Conversation FactCheck is accredited by the International Fact-Checking Network.
The Conversation’s FactCheck unit was the first fact-checking team in Australia and one of the first worldwide to be accredited by the International Fact-Checking Network, an alliance of fact-checkers hosted at the Poynter Institute in the US. Read more here.
Have you seen a “fact” worth checking? The Conversation’s FactCheck asks academic experts to test claims and see how true they are. We then ask a second academic to review an anonymous copy of the article. You can request a check at checkit@theconversation.edu.au. Please include the statement you would like us to check, the date it was made, and a link if possible.
Source: The Conversation (Au and NZ) – By Dylan McConnell, Researcher at the Australian German Climate and Energy College, The University of Melbourne
Look, this is probably the single most important issue to most households in South Australia — what they’ve been left with now are the highest energy prices in Australia — some say in the world — and the least reliable grid.
And it’s all because this government decided we had to go headlong into intermittent renewable energy without the baseload to support that transition.
– SA Liberal Party leader Steven Marshall, speaking at the SA Votes: Leaders’ Debate, Adelaide, March 5, 2018
Electricity prices and the reliability of South Australia’s energy grid will be key issues for voters in this Saturday’s state election.
During a public leaders’ debate, SA Liberal Party leader Steven Marshall claimed that, under the Weatherill Labor government, South Australians had been left with “the highest energy prices in Australia – some say in the world – and the least reliable grid”.
Marshall said this was “all because this [Labor] government decided we had to go headlong into intermittent renewable energy without the baseload to support that transition”.
Let’s look at the evidence.
Checking the source
A spokesperson for Marshall told The Conversation that when the opposition leader said energy prices, he was referring to retail electricity prices.
To support Marshall’s statement, the spokesperson provided The Conversation with two2017 documents from the Australian Energy Market Operator, one 2015 document from the Australian Energy Regulator, a letter from the Essential Services Commission of South Australia (ESCOSA) to the SA Minister for Energy Tom Koutsantonis, and a 2017 article from the Australian Financial Review.
Regarding the reliability of South Australia’s grid, the spokesperson said the Australian Energy Market Operator’s Electricity Statement of Opportunities shows that “in 2017-18 South Australia has the highest percentage of unserved energy at 0.0025%”, adding that “the reliability standard is 0.0020%”.
You can read the full response from Marshall’s office here.
Verdict
SA Liberal Party leader Steven Marshall said South Australia has “the highest energy prices in Australia — some say in the world”.
It’s true that South Australia has the highest retail electricity prices in Australia (although not in the world).
Marshall also said South Australia has the “the least reliable grid”.
In the energy industry, the word “reliability” means having enough energy generation capacity and inter-regional network capacity to supply customers.
The Australian Energy Market Operator is currently preparing estimates of unserved energy (the measure of reliability) for 2016-17. It is possible that there will be unserved energy for South Australia over this period.
However, it’s far from clear that South Australia would have had the highest level of unserved energy in the National Electricity Market.
People in South Australia do experience interruptions to their electricity supply.
But more than 97% of these are due to distribution outages (caused by things like trees falling on power lines) and are unrelated to the source of electricity – renewable or otherwise – flowing through the power lines.
There are many factors that affect electricity prices, grid reliability and power outages. Increasing levels of renewable energy generation is one factor.
Therefore, Marshall’s assertion that these outcomes are “all because this [Labor] government decided we had to go headlong into intermittent renewable energy without the baseload to support that transition” is incorrect.
Responding to the sources
The sources provided by Marshall’s spokesperson are from reputable government agencies. However, it’s far from clear that the sources support the conclusions Marshall drew in the leaders’ debate.
For example, the spokesperson cited an Australian Energy Market Operator (AEMO) report stating that South Australia would breach the regulator’s reliability standard in 2017-18.
But this is a projection, and doesn’t include some measures that have already been taken to ensure that the grid is reliable in 2017-18.
You can read more analysis of the sources provided by Marshall’s office here.
‘Energy’ vs ‘electricity’ prices
In making his statement, Marshall referred to “energy” prices. Energy and electricity prices are different things. Marshall’s spokesperson later told The Conversation that the MP was referring to “household electricity prices”.
Energy is a broad term that includes sources such as petrol, diesel, gas and renewables, among other things. Electricity is a specific form of energy that can be produced from many different sources.
The retail electricity price is what you’ll typically see in your home electricity bill, and is usually expressed in cents per kilowatt-hour (c/kWh).
Does South Australia have the highest retail electricity prices in the nation?
According the Australian Energy Market 2017 Residential Electricity Price Trends report, South Australia does indeed have the highest retail prices in the nation. Current prices for the typical SA customer are 37.79c/kWh.
According to that report, the Australian Capital Territory has the lowest retail electricity prices in Australia, at around 23.68 c/kWh.
The retail electricity price includes the wholesale price of the electricity, the network costs (or the “poles and wires” that bring the electricity to your home), retailing costs, and levies related to “green schemes” (such as the renewable energy target or solar feed-in tariffs).
The chart below shows how the different components contributed the electricity price increase in South Australia between 2007-08 and 2015-16.
For many years the drivers for retail prices have been network costs – which have very little to do with renewables.
But over the past 18 months, there has also been a increase in wholesale electricity prices across the entire National Electricity Market. A range of factors have contributed to this. These include the increase in gas prices, and the tightening of the supply-demand balance.
The ACCC is also investigating “transfer pricing” – which is when a business that’s an energy generator as well as a retailer shifts costs from one part of its business to another.
But as I’ll explain below, even if wholesale prices become the main driver of retail prices, it’s not accurate to place the blame squarely on renewables.
Does South Australia have the highest retail electricity prices in the world?
Because of differences in tax structures and energy systems, it’s no simple matter to compare energy and electricity prices between countries.
A 2017 Australian Competition and Consumer Commission report compared retail electricity prices among countries in the Organisation for Economic Co-operation and Development (OECD).
Australian prices were in the lower end of the range, but above the OECD total. While SA prices are above the Australian national average, they would still not be the most expensive in the OECD on a purchasing power parity basis.
Does South Australia have the ‘least reliable grid’?
In the context of energy supply, the word “reliable” will mean different things to different people.
The Australian Energy Market Commission defines “reliability” as having sufficient generation, demand side response, and interconnector capacity in the system to generate and transport electricity to meet consumer demand.
Under this definition, the National Energy Market meets a reliability standard as long as the maximum expected amount of “unserved energy” in any region doesn’t exceed 0.002% of the region’s annual energy consumption.
“Unserved energy” means the amount of customer demand that can’t be supplied within a region of the National Electricity Market, specifically due to a shortage of generation or interconnector capacity.
Marshall’s office did refer The Conversation to the AEMO’s Electricity Statement of Opportunities, which predicts South Australia’s unserved energy over 2017-18 at 0.0025%, just above the reliability standard.
However, and crucially, these projections do not include the new state-owned diesel generators (which can provide up to 276 megawatts) among other things. And these projections are made in order for the market to respond, and prevent the shortfall from occurring.
Between 2010-11 and 2015-16, the amount of unserved energy in the National Electricity Market was zero.
AEMO is currently preparing estimates of unserved energy for 2016-17. It is possible that there will be unserved energy for South Australia over this period.
However, it’s far from clear that South Australia would have had the highest level of unserved energy.
In fact, AEMO directed more load-shedding in New South Wales than South Australia on proportional basis. If this load-shedding were to be considered unserved energy, then New South Wales may technically have been less reliable.
Then why has South Australia had so many blackouts?
The technical definition above might not be of much comfort to South Australians experiencing power outages.
The average South Australian experienced 970 cumulative minutes of blackout in 2016-17. This was extraordinarily high due to the statewide blackouts in September 2016 caused by extreme weather. In 2015-16, the average total was 173 minutes.
But across the National Electricity Market the vast majority of these – over 97% – are due to distribution outages, which can be caused by anything from trees falling on power lines to “possum flashovers”. These occur regardless of the source of electricity flowing through the power lines.
Sources of supply interruptions in the NEM: 2007-08 to 2015-16.AEMC 2017, Reliability Frameworks Review, Interim Report (page 54)
South Australia may have the highest number of supply interruptions, but this is essentially unrelated to electricity supply mix.
Is this ‘all because’ of state Labor policy?
No. Even if wholesale prices become the main driver of retail prices, it’s not accurate to place the blame squarely on renewables.
Increased renewable energy generation may have contributed to decisions for some power plants to close. But so would other factors – such the A$400 million safety upgrade required for the Hazelwood power plant to have stayed open.
As mentioned above, other factors such as gas prices and competition issues have also contributed to increases in wholesale electricity prices. And as shown below, these are not confined to South Australia.
In this sense, Marshall was not correct to say that price increases are “all because this [Labor] government decided we had to go headlong into intermittent renewable energy without the baseload to support that transition”.
Indeed, a large proportion of the existing renewable investment in South Australia has been financed as a result of the federal Renewable Energy Target, introduced by the Howard government, rather than state policy. – Dylan McConnell
Blind review
I broadly agree with the verdict.
The price question is not contentious. South Australia has the highest retail electricity prices in Australia – but not in the world.
An argument could be made for South Australia being the least reliable system in the National Energy Market – if you look beyond the technical definition. A series of power losses and near misses in 2016-17 clearly raise questions for SA residents.
But, as the author rightly points out, the vast majority of these were caused by storms and other technical issues – not by renewables. – David Blowers
The Conversation is fact-checking the South Australian election. If you see a ‘fact’ you’d like checked, let us know by sending a note via email, Twitter or Facebook.
The Conversation FactCheck is accredited by the International Fact-Checking Network.
The Conversation’s FactCheck unit is the first fact-checking team in Australia and one of the first worldwide to be accredited by the International Fact-Checking Network, an alliance of fact-checkers hosted at the Poynter Institute in the US. Read more here.
Have you seen a “fact” worth checking? The Conversation’s FactCheck asks academic experts to test claims and see how true they are. We then ask a second academic to review an anonymous copy of the article. You can request a check at checkit@theconversation.edu.au. Please include the statement you would like us to check, the date it was made, and a link if possible.
Cicero, the Roman Stoic, once wrote to his friend Varro, pending a visit to his home: “If you have a garden in your library, we shall have all we want.” This same desire for good books and natural beauty is at the heart of Byung-Chul Han’s In Praise of the Earth, in which he reflects on gardening as a form of philosophical meditation.
Review: In Praise of the Earth: A Journey into the Garden – Byung-Chul Han (Polity)
Born in South Korea and based in Germany, Han has risen to prominence as a philosopher in the last ten years with a series of short, readable but penetrating works critiquing the values that govern contemporary capitalist society.
Han considers contemporary concerns like burnout, the loss of attention and information overload, drawing on thinkers such as Hegel, Marx and Nietzsche to diagnose the effects of digital capitalism.
As well as these canonical European thinkers, he considers the ideas of Eastern philosophers and poets like Lao Tzu and Bashō. Indeed he has written books on Zen Buddhism and the Chinese idea of shanzhai or “decreation”, which disrupts the usual hierarchy between real and fake.
Han is a rare thinker who can make complex ideas engaging without losing any of their intellectual acuity. He writes slim volumes, easily carried in a coat pocket, which brim with explosive diagnoses of contemporary ills while proposing new ways of living.
Byung-Chul Han pictured in 2015.Wikimedia Commons
In The Burnout Society, for instance, Han critiques the effects of what he calls “the achievement society”, in which efficiency and a relentless drive toward self-optimisation result in feelings of despair, loneliness and exhaustion. Against the tide of self-help manuals focusing on positivity and success, he suggests “rest and contemplation are acts of resistance against a world that demands constant productivity. In pausing we reclaim our humanity.”
In Praise of the Earth suggests the humble practice of gardening can offer one example of this kind of resistance. While he reflects on the deeper implications of gardening and thinking, Han’s book is also practical and personal. It is both a philosophical treatise on gardening and a diary of his experiences tending to his Bi-Won, Korean for “secret garden” in Berlin, over a period of three years.
Han describes gardening as a form of “silent meditation, a lingering in stillness”. Cultivating plants, he suggests, can transform our relationship to time. “Since I have begun working in my garden,” he writes, “I experience time differently. It passes much slower. It expands. The time until next spring feels like an eternity.”
This new sense of time is not only attuned to the changing seasons but to the growth of the plants and flowers he nurtures. “Every plant has its proper time,” he notes. “In the garden many such times overlap. The autumn crocus and the spring crocus have an altogether different sense of time.”
This awareness of overlapping time schemes prompts Han to reflect on what he describes as “the time of the other”, which invites an ethical response of care and concern. This time of the other is not related to acquisition or domination but instead thrives through a mutual act of cultivation.
For Han the time of the garden is fundamentally different to the time of digital capitalism, which is characterised by speed, distraction, and exploitation. “Digitalisation intensifies the noise of communication”.
In contrast, “the garden is an ecstatic place for lingering.”
The language of flowers
As a gardener, Han is entranced by the names of plants. Many of the book’s short chapters bear the names of those he is growing: Willow Catkins, White Forsythia, Anemones … These names prompt reflection: “Since I have taken up gardening, I try to remember as many flower names as possible.”
Reflecting on these names, Han begins to develop new ideas. He notes that astilbes are called Prachtspiere in German, which translates as “splendid splinters”. Spier means “small, tender tip”. He notes, “Without my garden, I would never have come across the word […] Such words widen my world.”
Astilbes, or splendid splinters.K8/unsplash, CC BY
His world also widens as his attention moves from language to nature more broadly and he starts to see plant life all around him in Berlin.
Before gardening, he writes, “I was in some way indifferent not only toward willow catkins but towards all plants. Today I see my former indifference as an embarrassing blindness.” Gardening opens our eyes to the movement of leaves and opens our ears to the buzzing of insects.
This reflection is complemented by Isabella Gresser’s botanical drawings interspersed throughout the book. The delicate, white line drawings on black paper are accompanied by the botanical names of the flowers in question, allowing the reader to linger.
Song of praise
The movement from the particular to the universal is one of the book’s great strengths. The practical problem of keeping a camellia alive on a snowy night prompts a reflection on care, while waiting for a Japanese allspice to bloom sparks a contemplation on the nature of hope. “Hoping is the temporal mode of the gardener,” Han writes.
Polity
By attending to the most minute bud of a flower Han believes we can begin to develop a “planetary consciousness”. This consciousness is accompanied by “a deep reverence for the Earth.”
This reverence is in turn complemented by one of the oldest philosophical sensations – that of wonder – which Plato described as the feeling that gives birth to philosophy.
In this spirit, Han writes,
We should learn again to wonder at the earth […] In the garden I experience that the earth is magical, enigmatic, and mysterious. As soon as you treat her as a resource to be exploited you have already destroyed her.
Han’s book is part of a long tradition of philosophical reflections on the art of gardening.
The followers of the ancient Greek philosopher Epicurus formed a community called “The Garden” where they practised philosophy among trees and flowers. Chinese literati found solace in ornamental gardens designed to reflect Taoist principles such as the unity of opposites.
It is also part of a recent wave of works in which contemporary thinkers reflect on the philosophical significance of gardens. Italian thinker Giorgio Agamben’s The Kingdom and the Garden (2019), for instance, illuminates the relationship between theological reflections on the biblical Garden of Eden and political theories of liberation.
In Praise of the Earth is a philosophical song, which finds in the most delicate blossom a resounding call for care. “Flowering is rapture,” Han writes and reading this book too, is a rapturous experience.
By clocking the distance in 3 minutes and 48.88 seconds (3:48.88) he also became the youngest male to break the 3:50 mark in the mile – aged 16 years and 294 days.
Not only was this an unbelievable performance for a 16-year-old, it was also his first time on an indoor (banked) track.
When you also account for the 50-hour travel time from his hometown Tauranga to Boston, and subsequent jetlag, the run becomes even more extraordinary.
Yet it was another example of an emerging trend in middle-distance running, from 800 to 3000 metres: teenagers looking increasingly comfortable on the world stage.
Ruthe isn’t alone. Australia’s Cam Myers (aged 19) has continued to build on his performances from last season, recently running a world under-20 indoor mile record in New York, to become the second all-time fastest in that age group.
Between Ruthe and Myers, performances like this have many athletics fans wondering, how are these young athletes already so good?
The answer goes beyond early specialisation or simply “running more”. Research increasingly points toward how middle-distance running performance actually emerges, not just how much mileage is done in training.
The importance of ‘running economy’
In running, aerobic capacity – called “VO2 max”, the maximum volume of oxygen consumed for energy production – obviously matters. But in middle-distance running it is rarely what separates good athletes from the great ones, like Ruthe and Myers.
What typically matters is the athlete’s running economy (or efficiency), which describes how much energy is required to run at a steady pace well below their maximum aerobic capacity.
Research suggests athletes with good running economy use less energy (and therefore less oxygen) than runners with poor economy, while running at the same speed.
Further studies also highlight athletes who have similar VO2 max values can still differ by up to 30% in running economy. That difference alone can translate into large performance gaps at race pace.
The biomechanical edge
Several factors appear to influence an athlete’s running economy, especially in reducing the energetic cost to the runner.
One of the key factors is effective production and transmission of ground reaction forces – the force the body applies into the ground and receives back with each step – along with muscle stiffness.
Additionally, biomechanical traits such as lighter body mass, efficient limb proportions and optimal torso-to-leg ratios further enhance running economy.
For developing athletes like Ruthe, these characteristics appear to reduce the mechanical demands of repeated ground contacts.
Also, shorter contact times between the foot and ground, and greater use of “elastic” energy (the storage and recoil of energy in the Achilles tendon), allow speed to be sustained with less muscular effort.
This was potentially enhanced further on the Boston University track, which is widely regarded as one of the world’s fastest indoor (or “short”) tracks.
When combined with sound training, this may explain why some younger athletes such as Ruthe appear “senior-ready” much earlier than expected.
Shoe technology is improving
Another factor quietly shaping modern performances is footwear technology. (Ruthe is sponsored by Nike.)
Advances in carbon-plate design and midsole foam in “super spike” running shoes have reduced the metabolic cost of running by improving energy return and mimimising energy loss during ground contact.
Evidence suggests modern super spikes can improve performance and enhance step length (with no reduction in step frequency) by 1–2%. In a 1500-metre race, this equates to about a 15-metre advantage at the elite level.
Lighter runners tend to compress modern foams more optimally, meaning a greater proportion of stored energy is returned during push-off in each step.
For younger athletes who already move efficiently, and are generally lighter than senior athletes, the shoes can amplify traits they already possess.
This doesn’t mean technology is a subsitute for talent, more that it rewards efficiency. This appears to be the case with Ruthe.
Where to next?
Whenever a young middle-distance runner breaks records, especially all the way from New Zealand, comparisons follow.
Norwegian star, 25-year-old Jakob Ingebrigtsen is the obvious reference point. He also ran world-class times across a range of distances as a teenager.
Before becoming an Olympic champion (1500-metres Tokyo 2021, 5000-metres Paris 2024), Ingebrigtsen ran his first 4-minute mile at 16 years and 250 days. Ruthe achieved this feat an entire year earlier.
Still, history reminds us that early excellence does not guarantee senior dominance. Many promising athletes disappear – not because they lacked talent, but because the system around them asked too much, too soon.
But according to Ruthe’s coach: “He trains like a 16-year-old, not like a fully professional.”
Nonetheless, while not training like a full pro, Ruthe has just been announced he will join Myers and Paris Olympics 1500-metre gold medallist Cole Hocker in the prestigious Bowerman Mile at the 2026 Prefontaine Classic in July.
New Zealand has a small but storied middle-distance history shaped by Olympic champions Peter Snell and John Walker. Ruthe’s recent performances have quickly elevated him into that lineage.
Despite his age, improved coaching knowledge, biomechanical understanding and technology are likely allowing his innate talent to express itself earlier.
The real story is that his performance invites us to rethink how middle-distance success emerges. Today’s best young athletes aren’t just fitter, they are more efficient, more economical and better supported to move well.
And in middle-distance running, athletes like Ruthe remind us that moving well often outweighs doing more.
Virus. The word evokes images of illness and fears of outbreaks. Yet, in the oceans, not all viruses are bad news.
Some play a helpful, even critical, role in sustaining marine life.
In a new study, we and an international team of scientists examined the behavior of marine viruses in a large band of oxygen-rich water just under the surface of the Atlantic Ocean. What we discovered there – and its role in the food web – shows marine viruses in a new light.
Studying something so tiny
Viruses are incredibly small, typically no more than tens of nanometers in diameter, nearly a hundred times smaller than a bacterium and more than a thousand times smaller than the width of a strand of hair.
In fact, viruses are so small that they cannot be seen using conventional microscopes.
An electron microscope view shows examples of Prochlorococcus myoviruses. Images A and D show different viruses with their tails. In B and C, the tail is contracted. The black scale bar indicates a length of 100 nanometers.MB Sullivan, et al., 2005, PLOS One, CC BY
Decades ago, scientists thought that marine viruses were neither abundant nor ecologically relevant, despite the clear relevance of viruses to humans, plants and animals.
Then, advances in the use of transmission electron microscopes in the late 1980s changed everything. Scientists were able to examine sea water at a very high magnification and saw tiny, circular objects containing DNA. These were viruses, and there were tens of millions of them per milliliter of water – tens of thousands of times greater than had been estimated in the past.
A theory for how viruses feed the marine world
Most marine viruses infect the cells of microorganisms – the bacteria and algae that serve as the base of the ocean food web and are responsible for about half the oxygen generated on the planet.
By the late 1990s, scientists realized that virus activity was likely shaping how carbon and nutrients cycled through ocean systems. We hypothesized, in what’s known as the viral shunt model, that the marine viruses break open the cells of microorganisms and release their carbon and nutrients into the water.
This process could increase the amount of nutrients reaching marine phytoplankton. Phytoplankton provide food for krill and fish, which in turn feed larger marine life across the oceans. That would mean viruses are essential to a food web that drives a vast global fisheries and aquaculture industry producing nearly 200 million metric tons of seafood.
The team took samples from a meters-thick band of oxygen that spreads for hundreds of miles across the subtropical Atlantic Ocean. In this region, part of the Sargasso Sea, single-celled cyanobacteria known as Prochlorococcus dominate marine photosynthesis with nearly 50,000 to upwards of 100,000 cells in every milliliter of seawater. These Prochlorococcus can be infected by viruses.
What are Prochlorococcus? Science Magazine.
By sequencing community RNA – molecules that carry genetic instructions within cells – our team was able to look at what nearly all viruses and their hosts were trying to do at once.
The viruses were attacking cells and spilling organic matter, which bacteria were taking up and using to fuel new growth. The bacteria respired away the carbon and released nitrogen as ammonium. And this nitrogen appears to have been stimulating photosynthesis and the growth of more Prochlorococcus cells, resulting in greater production that generated the ribbon of oxygen.
The viral infection was having an ecosystem-scale impact.
Scientists aboard a National Science Foundation research expedition in the open Atlantic in 2019 prepare equipment to collect water samples at different depths to analyze the activity of marine viruses.SW Wilhelm
Understanding the microscopic world matters
Viruses can cause acute, chronic and catastrophic effects on human and animal health. But this new research, made possible by an open-ocean expedition supported by the National Science Foundation, adds to a growing range of studies that demonstrate that viruses are central players in how ecosystems function, including by playing a role in storing carbon in the deep oceans.
We are living on a changing planet. Monitoring and responding to changes in the environment require an understanding of the microbes and mechanisms that drive global processes.
This new study is a reminder of how important it is to explore the microscopic world further – including the life of viruses that shape the fate of microbes and how the Earth system works.
Source: The Conversation (Au and NZ) – By Dennis B. Desmond, Lecturer, Cyberintelligence and Cybercrime Investigations, University of the Sunshine Coast
As a career counterintelligence officer for the US Federal Bureau of Investigation (FBI) and Defense Intelligence Agency, I worked inside a fully integrated intelligence system.
Signals intelligence from the National Security Agency guided investigations. Satellite imagery from the National Reconnaissance Office provided visibility into hostile environments. Human intelligence came through Defense Intelligence Agency channels.
These streams were strengthened by reporting from domestic and foreign partners. It was a closed, tightly controlled system.
But things have changed. Now private companies are supplying “intelligence as a service” to government entities and others – and as the Amazon-owned Ring doorbell camera company found out when it advertised a new feature last week, the change is not without controversy.
The rise of private intelligence
For most of the 20th century, intelligence remained the exclusive domain of nation states. Collection systems were expensive and specialised. They were protected by strict classification rules designed to safeguard sources and methods.
Intelligence agencies controlled the entire life cycle: human spying, signals interception, satellite surveillance, analysis, and dissemination to decision-makers. This created a closed command economy, where states maintained their own capabilities with legal oversight and institutional tradecraft.
Marine One flying over Defense Intelligence Agency headquarters in Washington DC.Dennis Desmond, CC BY
Today, that monopoly is eroding. It’s being replaced by a commercial intelligence marketplace operating alongside – and increasingly inside – government security structures.
The shift began in the late 20th century as open-source intelligence became more valuable. This happened with the rise of online forums, social media platforms and commercial satellite imagery.
Companies entered this market, scraping images from the web and content from social media sites. Clearview AI, perhaps the most well known, entered this market in 2017 – offering to identify people based on photos from social media.
Businesses quickly recognised the opportunity. Intelligence could be produced commercially, packaged, and sold.
The surveillance economy
At the same time, a broader surveillance economy emerged. It was driven by private companies, not governments.
Acoustic gunshot detection systems illustrate this convergence. Originally designed for military force protection, these sensors are now deployed across cities, providing real-time alerts to police. In Australia, this has manifested itself with hardware store chain Bunnings incorporating facial recognition technology from Hitachi.
Uncrewed aerial vehicles – better known as drones – have followed a similar pattern. Once limited to military reconnaissance, sensor-equipped drones are now widely available commercially. Parts of the battlefield surveillance grid have migrated into civilian life.
Perhaps the most significant shift comes from everyday consumer technology. Internet-connected door cameras, home security systems, and other “Internet of Things” devices now form a vast, privately owned sensor network. This is likely to grow, as products such as Meta’s planned facial-recognition smart glasses hit the market.
Real intelligence value but real privacy concerns
These systems were never intended as intelligence tools. Yet their intelligence value is undeniable.
In the recent case of the kidnapping of Nancy Guthrie in Arizona, for example, Nest door camera footage helped reconstruct movements and identify a possible kidnapper. The data was captured passively, through daily digital life.
This is intelligence collection by proxy. It is constant, ambient, and privately owned.
Amazon Ring’s attempt to launch its “Search Party” program demonstrates the tension.
Framed as a community safety feature, the program proposed using AI to scan neighbourhood camera footage to locate missing pets.
Concern escalated when Ring explored partnering with Flock Safety, whose automated license plate reader networks are widely used by law enforcement. Linking home surveillance cameras with other tracking systems signalled the emergence of a fully integrated commercial intelligence network.
Public backlash was swift – especially after the capability was advertised during the Super Bowl. Critics argued the pet-recovery narrative masked the normalisation of mass surveillance.
Commercial surveillance partnerships continue to expand. Networked cameras and license plate readers equipped with AI-powered object recognition enable vehicle tracking across jurisdictions.
Data brokers feed into this ecosystem too. They sell credit histories, utility records, and behavioural data to government clients.
Taken together, these developments represent “intelligence as a service”. Governments now buy cyber threat reporting, commercial sensor data, facial recognition, and behavioural analytics through subscriptions and data-sharing agreements. Intelligence production has become scalable, modular and market-driven.
This transformation raises serious governance questions. Commercial intelligence providers often operate under far looser legal restrictions. They allow agencies to circumvent data privacy laws.
Consumer-generated data, door cameras, vehicle telemetry and biometric identifiers can often be used by investigators without the need for a warrant. This complicates privacy protections and civil liberties safeguards.
None of this makes state intelligence services obsolete. Governments still retain unique authorities: human espionage, covert action, offensive cyber operations, and classified technical collection.
However, these capabilities now operate within a broader intelligence supply chain. Also in the mix are satellite firms, data brokers, AI analytics companies, and cyber intelligence vendors.
Questions for the future
The integration of commercial surveillance and artificial intelligence is likely to deepen.
Technology leaders envision a near future where cameras on homes, vehicles and public infrastructure feed constant video into AI systems. Citizens and police alike would operate under continuous algorithmic observation. Automated reporting would aim to shape behaviour.
The privatisation of intelligence is neither temporary nor accidental. It is the outcome of technological diffusion, data proliferation, and commercial innovation meeting demand from national security and law enforcement.
The question is not whether intelligence as a service will expand. It will.
The real question is different. What happens to national sovereignty, democratic oversight, and personal privacy when the power to collect and analyse intelligence no longer belongs solely to the state? What happens when it belongs to private actors willing to sell it?
Source: The Conversation (Au and NZ) – By Siegfried Gudergan, Professor of Strategy & Associate Dean (Research), James Cook University; Aalto University
Publicly funded research underpins much of daily life, from policy decisions to innovation and public debate. When research remains inaccessible, its value is diminished.
Australia has made real progress on open access to research. In 2024, around 59% of papers authored by researchers in Australia were freely available online.
Yet a large and mostly invisible gap remains. Hundreds of thousands of Australian research papers remain locked behind publisher paywalls, even though many of them could legally be shared right now.
This is because much of our open-access potential is never activated. However, there are simple ways to fix this, as we have shown with a recent university library initiative. Our results are now published in IFLA Journal.
The hidden potential of green open access
When people picture “open access”, they often think of journals that make articles free to read immediately. Sometimes the publishers charge steep fees to the authors in return for making the article free.
But there’s another pathway that has existed for decades: green open access. This option, also known as self-archiving, allows authors to share the accepted manuscript of a paper – the peer-reviewed version before journal formatting – through a university repository. Most publishers permit this, often after an embargo period.
In theory, this makes green open access one of the most scalable and cost-effective ways to improve access to research. In practice, however, it remains underused.
Many researchers are unsure which version of the paper they’re allowed to share. Others simply never return to older work stored on personal hard drives or in email archives. Over time, eligible manuscripts accumulate in forgotten folders, old attachments or cloud storage.
The result is a growing stock of publicly funded research that could be shared, but can’t be accessed by the public.
‘Bring out your dead’
At James Cook University, librarians suspected the issue of not submitting manuscripts to the repository was not resistance to open access. Researchers have competing demands on their time. While most academics support sharing their work, after publication their focus moves on to teaching, grants and new research.
Without a prompt or hands-on support to turn good intentions into action, depositing older papers rarely happens.
Rather than introducing new compliance rules, the university tested a different approach: a short, time-limited campaign to prompt action.
The initiative, called “Bring Out Your Dead!”, invited researchers to locate and submit older accepted manuscripts to the university’s repository. It ran for four months in 2024, leading into International Open Access Week.
The framing was deliberately light-hearted, but academics were offered substantial support to complete their submissions.
Librarians provided hands-on assistance with copyright checks, embargo rules and processing. Researchers didn’t need to navigate publisher policies themselves – just submit what they had.
During the campaign, researchers submitted 169 manuscripts. Across the full year, 233 papers were deposited – more than double the previous year’s total, and the highest annual deposit rate since the repository was established in 2006.
No new funding was allocated, nor did the library need to renegotiate any publishing agreements. By simply putting out the word and providing administrative support for the researchers to deposit their work, dozens of papers were made available to the public.
This approach could be easily scaled to any university and other publicly-funded research institutes and centres.
Small interventions, huge gains
In recent years, Australian universities have expanded immediate open access largely through “read and publish” agreements negotiated collectively with major publishers.
Through these arrangements, universities pay an agreed fee that combines journal subscription access with the ability for their researchers to publish a certain number of articles openly, without paying individual publication charges. This collective bargaining has increased open access across many high-volume journals and has removed upfront costs for many individual authors.
However, these agreements don’t cover all publishers, journals or disciplines, and their benefits are uneven. Not all researchers publish in journals included in the deals, and not all articles fall within the negotiated quotas. This is why green open access remains the most inclusive pathway.
For the wider public, the lesson is simple: much of the research you have already paid for exists, but remains unnecessarily hard to find. Studies that could inform healthcare decisions, education practice, environmental management, regional planning and public debate are often locked away – not because access is forbidden, but because no one has prompted or helped their release.
When research is easier to access, its value increases. Policymakers can draw on stronger evidence, practitioners can apply research findings more directly, journalists and community organisations can engage with original sources, and citizens can see how public funding translates into knowledge and impact.
Our work shows that small, low-cost changes to encourage green open access inside universities can unlock decades of research and make it available to everyone.
The authors acknowledge research collaborators Jayshree Mamtora and Tove Lemberget from James Cook University.
Scientific publishing relies on peer review as the mechanism that maintains trust in what we publish. When we read a journal article, we assume experts have rigorously scrutinised it before publication. This crucial system is currently under severe strain.
We conducted a comprehensive study of Australian academic journals and their editors – surveying 139 editors and interviewing 27. The picture is concerning.
Finding qualified peer reviewers has become one of the most significant challenges editors face. When peer review cannot be secured adequately, both the long-term viability of journals and research integrity suffer. The voluntary system underpinning academic trust is breaking down.
The scale of the crisis
More than half of the editors we surveyed (55%) rated finding reviewers as a significant or very significant challenge.
Some described having to send out 30 or more invitations to secure just two reviewers. One called the process “ridiculous”. Another expressed frustration with authors who had recently published in their journal yet “repeatedly refuse to review” for it.
There are also reviewers who say yes and then never do the review, which delays the process further.
The consequences are significant. Some journals now reject manuscripts outright when they cannot find suitable reviewers, despite the work being in scope and potentially valuable.
Publishing articles takes longer and quality research can go unpublished because it cannot be properly peer reviewed. This is a systemic crisis.
Why academics decline review invitations
Peer review remains entirely voluntary. Academics review manuscripts without payment, formal recognition, or acknowledgement in their workload.
Researchers face pressure to increase the quantity, quality and impact of their research. At the same time, universities are actively discouraging the activities that sustain scholarly publishing, with many editors reporting that their universities have removed editorial and peer review roles from workload models entirely.
As a consequence of workload intensification, scholars protect their time more carefully. Post-COVID shifts in work-life balance have also made academics more selective about how they allocate effort. At the same time, submission volumes continue to grow: more papers to review, fewer willing reviewers, besides the fact that not every author is a qualified reviewer.
There is also a lack of reciprocity. Authors who have just published often decline to review. Some editors suggested publishing in a journal should come with an obligation to review for it.
Current strategies fall short
Editors, of course, have developed workarounds. These include using databases to identify reviewers, running reviewer training workshops to mentor emerging scholars, mining reference lists, and relying more heavily on editorial boards.
They also report rejecting more papers at the initial screening stage, before sending them out for peer review, to reduce the number of manuscripts that need reviewing. But this increases the time required of editors.
An emerging concern raised by some editors is the appearance of reviews generated by artificial intelligence (AI). These reviews can be vague, confusing, and fail to improve manuscripts. This worsens the crisis. Peer review is supposed to be conducted by peers after all.
Systemic change is essential
Short-term strategies won’t solve this crisis.
Some proposed solutions include paying reviewers or introducing mandatory review requirements for authors to review an equal number of articles to those they publish. But these are not easy to implement.
Peer review is so integral to the scholarly system that research would grind to a halt without it.
Yet it remains invisible in how universities and research bodies measure success in the current metric-driven culture.
The core of the problem, as one editor put it, is that “the extrinsic or intrinsic benefits are just not as strong as they used to be”. Therefore, it needs to be better recognised and incentivised by universities and other stakeholders by actions such as including it in workload models, highlighting it in promotion criteria and so on.
Why this matters
This crisis affects all of us who rely on published research. It threatens the viability of journals, particularly local or independent journals not owned by big publishers. But fundamentally, it jeopardises the integrity of the scientific record itself.
We have built a publishing system dependent entirely on voluntary labour, especially for local and independent journals. Without significant change – without formal recognition, support, and genuine incentives – the shortage of reviewers will deepen. Publication schedules will suffer. The diversity of publishing outlets will diminish. Trust in peer review will erode.
The solution requires action from multiple stakeholders including universities, funders and research assessment bodies.
Scholarly communities must understand that sustaining peer review is a shared responsibility. The voluntary system underpinning academic trust has been taken for granted too long. It’s time to start properly valuing it.
Te Huia was launched in April 2021 for a five-year trial which was due to end in June 2026, but has now been extended by a year.RNZ / Gill Bonnett
The Hamilton-to-Auckland train, Te Huia, has been given an extra year to prove itself.
The train provides an interregional passenger rail service between the regions of Waikato and Auckland.
On Thursday afternoon the New Zealand Transport Agency (NZTA) board agreed to a Waikato Regional Council request to keep government funding steady at 60 percent for a one-year extension.
The council took the step to ask for the extension in December 2025, expressing a need for certainty from NZTA before the council began its long term plan process.
The council argued that the current trial had been too heavily affected by Covid delays, being temporarily banned from operating in Auckland, and repeated line closures on the Auckland network.
Te Huia was launched in April 2021 for a five-year trial which was due to end in June 2026. It will now continue until the end of June 2027 with government funding steady at a 60 percent funding assistance rate.
Waikato Regional Council said councillors would now be asked to support continued local funding at the current rate when they meet next week to consider the budget for 2026/27.
The future of Te Huia and its funding would then be discussed with the public as part of the 2027-2037 Long Term Plan process.
Waikato Regional Council chairperson Warren Maher thanked the NZTA board for its decision.
“I also note the support we received from local councils, as well as champions of Te Huia.”
In December, letters of support from Auckland, Hamilton City, Waipā and Waikato district councils said they were committed to sustainable economic growth across the sub-region, along the Hamilton to Auckland corridor, and in the emerging economic zone centred around the north Waikato and south Auckland areas.
Also earlier this month, approximately 300 supporters attended a “Stack the Station,” event at Hamilton’s Frankton Station, calling for the permanent future of the Te Huia passenger rail service.
The lawyer for the accused Bondi Beach gunman, Naveed Akram, commented in court that his client was subject to “very onerous conditions” at Goulburn’s supermax prison. Goulburn Correctional Complex, in New South Wales, houses the country’s highest security prison.
At the High Risk Management Correctional Centre, prisoners endure “very strict daily regimes and intense scrutiny by staff”, according to a review by the NSW Ombudsman. The ombudsman concluded there is “no doubt” the unit fails to provide “a therapeutic environment for these inmates”.
Goulburn’s supermax facility is set aside for the most serious offenders. It’s overwhelmingly populated with those who are convicted or accused of terrorism offences. They are categorised as requiring the “top level of security classifications”.
Given the gravity of the crimes of which Akram is accused, it makes sense he would be kept in such a facility. His case is among the worst of the worst.
But it’s the type of exception that normalises harsh prison conditions across the country. The solitary confinement, intensive surveillance and long periods of lockdown that Akram will experience even while he awaits court proceedings are becoming increasingly common, not just for accused mass murderers but for many non-violent prisoners too.
What are the rules for prisons?
The minimum standards for Australian prisons are set out in the 2025 Guiding Principles for Corrections. They promote safe practices in relation to health and wellbeing, rehabilitation and reintegration, and respectful interactions, while also maintaining prison security. They are not legally enforceable.
Inspectors of Custodial Services across the country seek to uphold minimum standards, ensure accountability and prevent breaches.
But their main role is systemic reviews, not investigating individual complaints. As with ombudsman reports, the recommendations of inspectors are non-binding.
Toothless monitoring and oversight bodies risk the Australian prison system becoming a law unto itself.
The Mandela Rules say prisoners should be treated with respect and dignity. They say prisoners should not be subjected to torture and other cruel, inhumane and degrading treatment or punishment.
Breaches of standards include prolonged isolation, overcrowding and excessive strip searches.
But these rules are also non-binding.
How do Australia’s prisons fare?
The unprecedented Australian prison population, which stands at almost 47,000, makes overcrowding and lockdowns more likely, and effective enforcement elusive.
The Productivity Commission has reported several jurisdictions where prison populations are either nearing or exceeding the facility’s capacity.
In New South Wales, minimum standards for children and adults in detention have largely evaded scrutiny for years.
The Goulburn Correctional Facility houses Australia’s highest-security prison.Lukas Coch/AAP
In 2021–22, the NSW Ombudsman received 147 reports of young people held in segregation for more than 24 hours. It was a 46% increase from the previous year.
In 2023–24, there were 878 notifications of young people in segregation.
In addition, the NSW Ombudsman found in 2022 that officers were conducting fully-naked strip searches on young people in youth detention.
In adults prisons, segregation rates are not consistently recorded. But the NSW Ombudsman found in 2024 that of its sample of prisoners who were penalised with cell confinement, about three quarters were classed as particularly vulnerable, including 42% who were Aboriginal.
First Nations people most at risk
A further breach is systemic discrimination on the grounds of race.
First Nations people account for 37% of people in prison in Australia. But there are inadequate levels of Indigenous staffing. There are also very few cultural therapeutic programs and health and wellbeing services.
In 2025, the NSW inspector of custodial services expressed deep concern about the number of Aboriginal deaths in custody in the state. The inspector’s report highlighted “poor conditions in many correctional centres caused by a combination of understaffing, excessive lockdowns, poor staff culture, aged infrastructure, and high remand numbers”.
Accordingly, Australia must also establish and facilitate “a system of regular visits undertaken by independent international and national bodies to places where people are deprived of their liberty, in order to prevent torture”. These inspections are carried out unannounced in order to identify torture risks without state interference or window dressing.
But NSW, Victoria and Queensland, which have the highest prison populations, have consistently failed to implement the minimum standards outlined in the protocol.
The NSW and Queensland governments refused access to prisons in the first visit to Australia of the United Nations Subcommittee on Prevention of Torture in 2022.
This is an indictment on these governments’ lack of cooperation, especially given countries across South America, the Middle East and Africa with fewer resources to uphold standards have complied.
The slippery slope
The severe supermax prison conditions Naveed Akram will endure for the foreseeable future may be met with public approval.
However, extreme cases can give rise to a slippery slope of inflicting inhumane conditions on the great majority of people in prison: those on remand, sentenced for non-violent offences and held for breach of justice procedures.
As Nelson Mandela remarked, “no one truly knows a nation until one has been inside its jails”. Looking inside Australian prisons tells a story of prejudice, few protections and lack of transparency and accountability.
Source: The Conversation (Au and NZ) – By Se Youn Park, Sessional academic, School of Political Science and International Studies, The University of Queensland
Australian Prime Minister Anthony Albanese said his government will not help repatriate the 34 Australian women and children with links to Islamic State fighters who were released from a detention camp in Syria and are reportedly trying to return to Australia.
The women and children were among more than 2,000 people from 50 different countries detained at al-Roj camp in Kurdish-controlled northern Syria. The Australians were turned back by Syrian officials when trying to reach Damascus this week, with the goal of returning to Australia.
The Albanese government’s stance on the Australian women and children in Syria has never really been clarified, which is fuelling a lot of uncertainty at the moment.
There’s a precedent for repatriation
Australia has demonstrated it can repatriate its citizens safely when it feels compelled to. In 2022, for example, it helped repatriate four women – the wives and widows of IS militants – and their 13 children from al-Roj camp in Syria.
Women and children walk among tents at al-Roj camp in northeastern Syria.Baderkhan Ahmad/AP
It has also acknowledged that if citizens return independently from conflict zones, security agencies are capable of investigating and managing any risks.
Yet, it has not established a permanent framework for when and how such returns should occur.
Instead, Australia continues to rely on ad hoc decision-making shaped by individual circumstances, rather than a solid plan. This case-by-case approach has produced uneven and opaque outcomes.
Take for example the four women repatriated in 2022. What happened next remains only partially known. One of the women, Mariam Raad, was prosecuted in Australia for entering Islamic State-controlled territory. She pleaded guilty, but was discharged without conviction and placed on a good behaviour bond.
Others, including Mariam Dabboussy, returned and resettled in the community. Yet, there is little publicly available information about their legal situations, monitoring arrangements or long-term reintegration plans.
This opacity makes it difficult to assess whether Australia is applying consistent legal standards or managing risk systematically.
Mitigating risks through managed returns
The ambiguity here reflects a broader pattern of political caution and strategic delay.
For years, Australian governments framed the repatriation of citizens who had travelled to Syria or Iraq as an unacceptable security risk. They relied on citizenship revocation and political refusal to prevent it.
In 2022, however, the High Court limited the government’s power to revoke citizenship, removing one of these key tools.
At the same time, the conditions in the Syrian detention camps deteriorated, heightening international pressure on countries to repatriate their citizens trapped there.
These factors eventually forced a shift in Australia’s stance, resulting in the 2022 repatriation. However, this shift was never institutionalised.
In 2024, then-Home Affairs Minister Clare O’Neil seemed set to do this by preparing a plan to repatriate the remaining women and children. However, this plan was shelved and never revisited.
As a result, the problem has been deferred rather than resolved. This weakens Australia’s ability to manage the possible security risk posed by these women effectively. Leaving citizens in overseas detention does not eliminate risk. It just makes it somebody else’s problem.
When individuals remain in foreign camps, Australian authorities cannot monitor them effectively, prosecute them or support their disengagement from radical ideologies. This limits our intelligence capabilities and our ability to track former members and the potential threat they pose.
Avoiding repatriation does not prevent their return, either. It just makes returns harder to manage.
Some allies have a different approach
Last October, two Australian women and their four children escaped a camp in Syria and made their own way to Lebanon. Once at the Australian embassy, they were given passports to return to Australia.
When individuals return through informal pathways such as this, authorities have less time to prepare and fewer opportunities to implement structured legal, monitoring and reintegration measures. It’s also far more dangerous for the people involved.
Many of Australia’s allies have recognised this reality.
Several European governments have also begun repatriating women and children with more urgency.
Countries such as the Netherlands and Germany have implemented planned repatriation programmes linked to judicial processes and long-term supervision. These governments recognise that repatriation is not a concession. It is a security management strategy.
France, too, which had long been hesitant to repatriate its nationals from Syria, shifted from a “case-by-case” approach in 2022 after facing criticism from the European Court of Human Rights and the UN Committee Against Torture.
Responsibility to protect
There is also a deeper legal issue at stake. Many Australian women detained in Syria have been held for years without charge or trial. By leaving citizens in indefinite offshore detention, Australia risks undermining its commitment to due process and the rule of law.
The choice is not between security and accountability. It is between managing citizens within Australia’s legal system or leaving them in unstable environments where Australia has no oversight.
The question is no longer whether Australian women and children will return. It is whether Australia will manage their return deliberately, or continue responding only after events force its hand.
Sussan Ley has announced that, after a fortnight’s farewell tour, she will step down as the member for Farrer.
This sets the stage for what will be one of the most interesting and unpredictable byelections in Australian history. Potentially at least four candidates could have a realistic chance of winning. The byelection will be an early test of new Opposition Leader Angus Taylor’s popularity, and whether One Nation can translate strong performance in opinion polls into actual votes. It will likely be held some time in April or May.
The independent challenge
At the 2025 election, Ley suffered a 9% drop in her primary vote, to 43%. Independent Michelle Milthorpe, a local teacher, picked up 20% of the vote.
This large electorate – four times the size of Belgium – is more difficult for a challenger to cover than a well resourced sitting member.
Milthorpe received almost two-thirds of the preferences from other candidates. This allowed her to narrow the primary vote gap. She finished with 44% of the two-candidate preferred vote, compared to Ley’s 56%.
She therefore needs a 6% swing to win the seat. This is a significant swing but the Liberals will be without any personal vote Ley has gathered over 25 years as the local member. (In 2022, when there was not a significant independent vote, Ley won 52% of the primary vote, while the Coalition Senate team only got 46% in Farrer.)
Moreover, opinion polls suggest the Liberals’ national brand has taken a big hit.
Milthorpe has maintained her profile in the electorate since the election and has already announced she is running again.
Farrer is across the Murray River from Indi, held since 2013 by independents Cathy McGowan and then Helen Haines. Some of Haines’ supporters may well campaign for Milthorpe.
Once the Liberal vote drops into the low 40s they are vulnerable to teals and community independents. Liberal Sophie Mirabella won 45% of the primary vote in Indi in 2013 but still lost to McGowan. And high-profile Liberal Josh Frydenberg had 43% of the primary vote in Kooyong in 2022 but still lost to teal independent Monique Ryan.
Milthorpe is a serious chance to join the growing crossbench in the federal parliament.
Other likely candidates
For now, the on-again-off-again coalition between the Nationals and Liberals is on. Their agreement means they do not stand candidates against each other when there is a sitting member.
But Ley’s resignation means both parties can stand, and the Nationals have confirmed they will field a candidate. The last time there were competing Liberal and National candidates was after former deputy prime minister Tim Fischer retired in 2001. Sussan Ley was the successful Liberal candidate, but her victory margin over the Nationals candidate was a mere 0.1%.
One Nation polled 6.6% in Farrer in 2025, very similar to its share of the national vote. Given that opinion polls suggest One Nation’s national vote has risen to over 20%, it is likely to attract a much higher vote in the byelection than it did in 2025.
One Nation is likely to pick up – either on primaries or through preferences – much of the 10% that went to other right-wing parties in 2025. These include Shooters, Fishers and Farmers; Gerard Rennick People First; Family First and Clive Palmer’s Trumpet of Patriots.
The Liberal and National how-to-vote cards will preference each other ahead of One Nation. But this does not mean all their voters will follow them. One Nation will be hoping they can out-poll the Nationals and then enough Nationals voters give their second preference to One Nation that the One Nation candidate overtakes the Liberal. One Nation may then get enough preferences from Liberal voters to beat the independent.
Labor has never held Farrer since the seat was created in 1949. The incumbent government almost always goes backwards at byelections. So it is highly unlikely Labor can win the seat.
But the preferences of their supporters may determine which candidate does. Whether Labor runs – and it won just 15% of first preferences at the 2025 federal election – may depend on how important they regard it to guide these preferences with how-to-vote cards. In the longer term, it is in Labor’s interests for a progressive independent to establish themselves in a seat Labor cannot win themselves.
There have been reports of some Farrer voters urging the independent member for the NSW state seat of Murray, Helen Dalton, to also run as an independent. Other reports suggest that One Nation has sounded her out about being their candidate. But it would be a big gamble to give up her state seat to become one of four or five contenders for Farrer.
If the Liberals do hold the seat, they will be saying “well done Angus”. If they lose it to a moderate independent, there may be some buyer’s remorse about replacing Ley with Taylor. If they lose it to One Nation, some will be eyeing Andrew Hastie as their next leader.
Source: The Conversation (Au and NZ) – By Adam Simpson, Senior Lecturer in International Studies in the School of Society and Culture, Adelaide University
Thailand’s prime minister, Anutin Charnvirakul, will almost certainly stay in the job after a surprise result in last week’s elections saw his conservative Bhumjaithai Party win the most seats in the lower house.
The outcome was another significant setback for the progressive People’s Party – and Thailand’s pro-democracy movement more broadly.
While the People’s Party made some missteps in the campaign, the election demonstrates, yet again, the immense hurdles faced by progressive, democratic parties in a country where pro-military and pro-monarchy forces have outsized influence in politics.
The People’s Party finished second after leading in most pre-election polls. It will now be the primary opposition party in the country.
The formerly powerful Pheu Thai party came a distant third, and agreed to join the Bhumjaithai-led ruling coalition.
So, what does the election mean for the direction of a country? And what’s next for the pro-democracy movement that has attempted for years to bring reforms to the country?
Who is Anutin Charnvirakul?
Anutin took over the Bhumjaithai Party from his father, a former acting premier, in 2014. He had already followed his father into the family construction business, one of Thailand’s biggest.
Prime Minister Anutin Charnvirakul, head of the Bhumjaithai Party.Rungroj Yongrit/EPA
Anutin rose to the premiership last year after the previous prime minister, Paetongtarn Shinawatra, was removed from office for purportedly being too conciliatory towards Cambodia over an ongoing border dispute.
Anutin was elected prime minister in the parliament with the surprise backing of the People’s Party, in exchange for the promise of constitutional reform.
This elevated Anutin’s previously provincial Bhumjaithai Party to be a national-level player. It also allowed him to attract influential defectors from other parties to consolidate his position.
Support for his government dropped in early December due to the mishandling of floods in southern Thailand and alleged connections of his government to transnational scam criminals.
Soon after, Anutin launched preemptive airstrikes against Cambodia over their border dispute. This boosted nationalist sentiment among the public and providing a welcome distraction from domestic pressures.
With the People’s Party looking ready to withdraw support from the ruling coalition, Anutin then dissolved parliament and called early elections.
The airstrikes, drone attacks and ground clashes continued for the next few weeks along the border, ensuring national security would be a key election theme. This worked in favour of the conservatives, but provided challenges for the People’s Party.
Do progressive stand a chance in Thailand?
Many of the People’s Party’s problems are rooted in the struggles of predecessor parties to gain a toehold in Thai politics.
In the last election in 2023, the Move Forward Party won the most seats. But its popular leader was prevented from becoming prime minister by conservative forces in Thai society.
Thailand’s Constitutional Court then dissolved the party. This followed a pattern: its predecessor, the Future Forward party, was dissolved after its strong showing in the 2019 election.
Within 24 hours of the polls closing last week, the National Anti-Corruption Commission unanimously ruled that 44 former lawmakers from the Move Forward party committed gross ethical misconduct by proposing amendments to the Criminal Code’s Section 112. This is the lèse majesté law that carries stiff penalties for insulting or defaming Thailand’s monarchy.
The lawmakers, which include the People’s Party leader, Natthaphong Ruengpanyawut, and 14 other newly elected party MPs, could face lifetime bans from politics.
Did support collapse for the People’s Party?
Although Bhumjaithai handily won the election, capturing nearly 200 seats out of 500 in the lower house, the voting data suggest the People’s Party did not haemorrhage support to Bhumjaithai, as various news headlines made it seem.
Under the military-authored 2017 constitution, Thailand’s lower house elections include 400 individual constituency seats elected by first-past-the-post and 100 party list seats elected by proportional representation.
Bhumjaithai did very well in rural and regional constituency seats, where alleged vote-buying and patronage networks are more prevalent.
Some groups across the country have demanded national recounts following reports of electoral irregularities, in addition to the release of vote counts from polling stations and the re-running of some races.
A man holding a banner reading ‘nationwide vote recount’ protests at the national electoral office in Bangkok.Rungroj Yongrit/EPA
The party’s support in constituency seats was mostly concentrated in cosmopolitan centres with more educated urban voters, such as Bangkok, where it swept all 33 seats. However, it struggled to win seats in rural and regional areas.
In the national party list vote, though, the progressive party emerged clear winners. It earned around 30% of the national vote, compared with only 18% for Bhumjaithai in second place.
This suggests some people split their votes, supporting a Bhumjaithai candidate for their local seat and the People’s Party in the party list. Unfortunately for the People’s Party, the party list MPs only comprise one-fifth of the lower house.
In a small silver lining for progressive forces, a referendum on amending the constitution (held at the same time as the election) passed easily.
But Anutin and the conservatives are now in control of the drafting and approval process, which they could draw out for years. And in their hands, it may not deliver the changes sought by progressives anyway.
For interest groups and lobbyists, face-to-face time with political decision-makers is the most valuable kind of access there is.
As one New Zealand politician once put it (speaking anonymously to lobbying researchers), “politics is so much about relationships”. In-person meetings help build trust, develop shared priorities and identify where influence is possible.
This form of influence can often be hidden from view. In New Zealand, however, ministers’ diaries have been published since 2017, offering a window into who is meeting with whom.
Because transport policy has far-reaching consequences for climate, health and everyday life, we wanted to see what political access in this sector looks like in practice.
Our newly-published research analysed the diaries of transport and associate transport ministers under the two most recent governments – the Labour-Green-New Zealand First coalition (2017-2020) and the subsequent Labour government (2020-2022).
It offers a useful snapshot with some clear patterns – but one that needs to be interpreted with care.
What the diaries tell us
For meetings with interest groups related to the transport portfolios (880 out of a total of 11,079 meetings) we categorised the interest groups two ways: the type of interest group and the group’s focus – that is, the specific area of transport it seemed concerned with.
The first classification was adapted from a European approach to categorising interest groups. The second was developed by examining the groups’ websites and coding their main areas of focus, such as air travel, freight or consultancy.
Of the 974 groups we identified, 74% were commercial (56% firms and 18% business associations). Among non-commercial groups, citizen groups (9%) and trade unions (7%) were the most common.
Overall, commercial groups met with transport ministers about three times as often as non-commercial groups.
Looking at what these groups focused on, air travel (such as airlines and airports) had the highest level of access, accounting for 16% of meetings. Maritime (11%), rail (9%), automobiles (8%) and consultancy – including economic, trade and policy consultancies, law firms, and PR and lobbying firms (6%) – rounded out the top five.
Some groups were notable by their absence. Iwi and hapū and their organisations accounted for just 1% of encounters, despite the transport system’s well-documented failures for Māori, including lower access to transport and higher levels of harm.
Health groups were also rarely present, with just six encounters (0.7%) over the six years studied, even though the transport system causes at least as much health harm as tobacco.
An incomplete picture
Importantly, there are limits to what this analysis can show.
While the diaries provide a trove of information, they don’t record who asked for meetings but was turned away. That means we can’t tell whether groups absent from the records never sought access, or sought it and didn’t get it.
The diaries don’t capture more informal forms of access, such as conversations in social settings.
We also have to assume the records are complete and accurate, even though that may not always be the case. And because they don’t record the purpose of each meeting, we can only infer what was discussed.
There is clearly some discretion in who gets these meetings. Looking across the diaries of two ministers and three associate ministers, we found differences in both the overall number of meetings and the balance between commercial and non-commercial groups.
While all ministers met with more commercial than non-commercial groups, the ratio varied widely – from 1.6:1 to as high as 10:1.
Categorising interest groups is also challenging, and broad categories inevitably hide important differences. For example, some of the firms classed as commercial are partially owned by local or central government. Likewise, some commercial groups focus primarily on sustainable transport.
All of this means the diaries can show us who gets access, but not how that access translates into policy outcomes.
That question remains important, because part of the period covered by this analysis coincided with substantial – and now largely reversed – efforts to reshape the transport system around low-carbon goals. Yet groups supporting that agenda were a minority in these diaries.
In other words, major policy change happened without those groups dominating face-to-face access to ministers. This suggests that access is only part of what shapes policy and that the flow of influence between ministers and interest groups may be two-way; ministers and interest groups may both be using these meetings to promote their policy agenda.
Despite the challenges and limitations of the diary data, it suggests a clear pattern: commercial interest groups had much greater access to ministers than non-commercial groups. This is consistent with the small number of similar studies internationally – and highlights structured differences in who gets this most valued form of political access.
This analysis was based on work undertaken by a larger group of authors, including Alex Macmillan, Ryan Gage and Alice Miller.
Child vaccination has been one of Australia’s biggest success stories. Before the COVID pandemic, we hit the national target of 95% of one-year-olds fully vaccinated. Our child vaccination rates were among the best in the world.
Vaccination protects children from potentially severe illnesses such as measles, mumps and whooping cough. These diseases can cause severe pain, put children in hospital, risk their lives and leave them with ongoing health problems.
But Australia’s vaccine success is quickly slipping away. After the pandemic, the share of one-year-olds who are fully vaccinated kept falling. In some areas, it’s now barely 80%.
The risks are real. Whooping cough notifications are the highest since records began, 35 years ago. In the past week, there have been measles exposure sites in Sydney and regional New South Wales, including hospitals and a high-school hall.
We don’t want to end up like other countries. In America, dozens of people have been hospitalised with measles already this year, and Canada has lost its measles elimination status. An outbreak in London is putting children in hospital, and may force unvaccinated children to stay home from school.
Why aim high?
One-year-old fully immunised babies have received vaccinations for diphtheria, tetanus, pertussis (whooping cough), polio, hepatitis B, Haemophilus influenzae type b (Hib) and pneumococcal disease.
High vaccination coverage is necessary to achieve herd immunity: the point where diseases find it hard to spread to children who aren’t vaccinated. Some children aren’t vaccinated because they are too young. Others can’t be vaccinated because they have weakened immune systems.
When 95% of children are vaccinated, it’s difficult for even highly infectious diseases such as measles to spread in the community, protecting both the vaccinated and unvaccinated.
Grattan Institute analysis shows that over the past five years, Australia has recorded an unprecedented slide in the proportion of one-year-olds who are fully vaccinated. In the year to 30 September 2025, 92% of one-year-olds were fully vaccinated, compared with 95% in 2020.
Many parts of Australia are now well below national vaccination targets. Five years ago, 56% of regions and suburbs were achieving the national target for one-year old vaccination. Today it is just 18%.
Notes: SA3s are geographical areas typically covering a population of between 30,000 and 130,000 people. Data are for the four quarters to 30 September, rather than the calendar year. Due to boundary changes, some areas (shown in grey) cannot be directly compared between time periods.Grattan Institute analysis of Department of Health, Disability, and Ageing (2026)
Some areas are falling further behind
The declines have been biggest where children were already more vulnerable.
In the 10% of areas with the highest vaccination for one-year olds, uptake slid by just 1.3 percentage points since 2020 – from an average of 98% in 2020 to 97% in 2025.
But in the areas with the lowest vaccination, the fall was more than four times greater, at 5.7 percentage points – from an average of 90% in 2020 to 84% in 2025.
Notes: SA3s are geographical areas typically covering a population of between 30,000 and 130,000 people. Data are for the four quarters to 30 September in each year, rather than the calendar year.Grattan Institute analysis of Department of Health, Disability, and Ageing (2026)
Almost no area has recorded a vaccination increase. And every state has areas with sharp falls.
Some of the biggest surges in the share of one-year olds who are fully vaccinated are in:
Bankstown, Sydney, from 92.2% to 84.8%
Keilor, Melbourne, from 95.8% to 88.8%
Gascoyne, Western Australia, from 95.6% to 76.9%
Nerang, Queensland, from 94.1% to 82.2%
Barkly, Northern Territory, from 96.2% to 87.0%
Meander Valley and West Tamar, Tasmania, from 92.6% to 83.5%.
Notes: SA3s are geographical areas typically covering a population of between 30,000 and 130,000 people. Only SA3s in which data was available for both 2020 and 2025 are displayed. Data are for the four quarters to 30 September in each year, rather than the calendar year.Grattan Institute analysis of Department of Health, Disability, and Ageing (2026)
There is no single profile for communities with dangerously low vaccination. They are in cities and rural areas, in wealthy and poorer areas, and in every capital city.
Note: SA3s are geographical areas typically covering a population of between 30,000 and 130,000 people. Remoteness classification uses the Modified Monash Model. Each SA3 has been assigned to the MMM category in which the majority of its population live. Average vaccination rate is the population-weighted mean vaccination rate for SA3s within the MMM category. Data are for the four quarters to 30 September 2025, rather than the calendar year.Grattan Institute analysis of Department of Health, Disability, and Ageing (2026), Department of Health and Aged Care (2023), and ABS (2025)
Why the decline?
It has become much harder to get children vaccinated, and it’s not down to a single factor.
Instead, a major survey suggests a mix of psychological barriers to acceptance and practical barriers to access.
Misinformation and the intense debate around COVID vaccines has likely eroded trust in childhood vaccination. Among parents with unvaccinated children, almost half don’t think vaccines are safe.
But practical barriers matter too. One in four parents whose children are only partially vaccinated say it’s difficult to get an appointment when their child’s vaccination is due.
Governments have a plan – now they need to act
Australia’s federal and state governments must tackle both types of problem.
They agree. They are gearing up to respond to this emerging public health crisis with a new national vaccination strategy, agreed last year. It sets the right directions by emphasising building trust in vaccines, strengthening the immunisation workforce, using data to target effort and increasing accountability for getting results.
But the true test will be federal and state government budgets released in coming months. Those budgets must make new investments that turn the strategy into decisive action.
The investments should span the full gamut of the strategy, including:
public advertising
combating misinformation by better understanding community beliefs, tailoring government information and advertising, and helping health workers engage effectively with sceptical patients
modernising data systems to track trends and focus effort
delivering vaccination more often in more places, such as workplaces, community centres, and homes.
Crucially, tougher targets are needed to stop some communities falling behind, and funding for local efforts, tailored to local needs, to help them catch up.
Australia has hit ambitious vaccination targets before. Getting back to pre-pandemic levels will be harder than achieving them the first time, so governments must step up and redouble their efforts to protect Australia’s children.
Source: The Conversation (Au and NZ) – By Evelyn Parr, Research Fellow in Exercise Metabolism and Nutrition, Mary MacKillop Institute for Health Research, Australian Catholic University
Intermittent fasting has become a buzzword in nutrition circles, with many people looking to it as a way to lose weight or improve their health.
But new research from the Cochrane Collaboration shows intermittent fasting is no more effective for weight loss than receiving traditional dietary advice or even doing nothing at all.
In this international review, researchers assessed 22 studies involving 1,995 adults who were classified as overweight (with a body mass index of 25–29.9 kg/m²) or obese (with a BMI of 30 kg/m² or above) to assess the effectiveness of intermittent fasting for up to 12 months.
The authors found, when compared to energy restricted dieting, intermittent fasting doesn’t seem to work for people who are overweight or obese and are trying to lose weight. However they note intermittent fasting may still be a reasonable option for some people.
Alternate day fasting, for example, resulted in more weight loss when compared to time-restricted eating.
This is because participants who fasted every second day consumed about 20% less energy than those following time-restricted eating.
What did the Cochrane review find?
Cochrane review use gold-standard techniques to give an objective overview of the evidence. This review looked at 22 individual randomised controlled trials published between 2016 and 2024 from North America, Europe, China, Australia and South America.
The trials compared the outcomes of almost 2,000 adults who were classified as being overweight or obese. These participants either:
received standard dietary advice, such as restricting calories or eating different types of foods
practised intermittent fasting
received either regular dietary advice, no intervention or were on a wait list.
The authors found:
1. Intermittent fasting was no better than getting dietary advice
The researchers found intermittent fasting and receiving dietary advice to restrict energy intake led to similar levels of weight loss.
This finding was based on 21 studies involving 1,713 people, with the researchers measuring the change from the participants’ starting weight.
Dietary advice (from registered dietitians or trained researchers) could include an eating plan focused on fruit, vegetables, whole grains and seafood, restricting calories, or any specific dietary advice for weight loss.
The amount of weight the participants lost ranged from a 10% loss to a 1% gain, with either intermittent fasting or dietary advice.
These findings are similar to several recentmeta-analyses which found intermittent fasting is no better than dieting.
Previous research has found most of the alternate day fasting and periodic diet studies leads to about 6% to 7% weight loss. This is compared to very low energy “shake” diets (about 10%), GLP-1 medications (15% to 20%) and surgery (above 20%).
The review also found intermittent fasting likely makes little difference to a person’s quality of life, based on only three studies.
2. Intermittent fasting was no better than doing nothing
The researchers found intermittent fasting and no intervention led to similar levels of weight loss. This finding was based on six studies involving 448 people.
In the intermittent fasting studies, participants experienced about 5% weight loss. The “no intervention” or control group lost about 2% of their original weight.
In research, a 3% difference in weight loss is not considered clinically meaningful. That’s why the authors of this review concluded intermittent fasting is no more effective for weight loss than doing nothing at all.
However, the result for the “no intervention” condition could be due to the Hawthorne effect: the tendency for people to behave differently because they know they are being watched, such as in a clinical trial.
What are the review’s limitations?
There were few large, high-quality randomised controlled trials to draw on.
Only six studies were included in the part of the review which compared intermittent fasting and doing nothing. Two of these focused on time-restricted eating, which is arguably the least effective weight-loss strategy. One looked at the effects of fasting for one day per week. The other three were intermittent fasting studies, each with varying control groups, where some received guidance and others did not.
Also, the review only looked at studies where the interventions lasted between six and 12 months. It’s possible intermittent fasting strategies could be a long-term tool for weight maintenance. So we need to do more research, and ideally studies of longer duration.
In one 2024 study, researchers found intermittent fasting may lead to changes in metabolism and the gut that restrict how cancer develops. Another study from 2025 found intermittent fasting could improve the metabolic health of shift workers.
So if you’re practising or considering intermittent fasting, the current evidence suggests it can be a safe and effective way to manage your weight.
But for any weight loss strategy to work, it needs to align with your personal preferences. And it’s best to consult a health-care professional before starting any new diet, especially if you have any underlying health conditions.
Depression is a complex and deeply personal experience. While almost everyone has periods of sadness, low mood or grief, depression is different. Major depressive disorder is persistent, interferes with day-to-day activities, and can affect work, life and relationships.
One in five people will experience depression in their lifetime. Women are nearly twice as likely as men to develop it – a disparity that emerges around puberty and persists into adulthood.
But what causes it? The short answer is: many different things.
While there are various theories, we know brain chemistry, genes, hormones, stress, lifestyle and personality can all play a role. How these interact can vary greatly from one person to another.
An imbalance of brain chemicals?
The traditional “monoamine hypothesis” of depression was proposed more than half a century ago, in the 1950s. This theory suggests the root cause of depression is a deficiency in certain brain chemicals (or neurotransmitters) called monoamines – serotonin, dopamine and norepinephrine.
Several antidepressants have been developed based on this. They primarily work by increasing levels of monoamines such as serotonin.
However, it has become clear that the “chemical imbalance” explanation is an oversimplification.
Research over the past few decades has not found consistent evidence that individuals with depression always have lower levels of serotonin, or any single neurotransmitter.
Current understanding recognises depression as a complex condition influenced by multiple interacting factors, including genetics, trauma, medications, diet, sleep patterns and social interactions.
Genetic factors can increase your risk
According to one 2021 review, around 30 to 50% of the risk someone will develop depression may be inherited.
No single “depression gene” has been found. But large studies have identified over 100 genetic risk markers on chromosomes.
The genetic risk of depression is also thought to be “polygenic”. This means multiple genetic variants (each carrying a small effect) interact and collectively contribute to someone’s genetic risk.
One important and longstanding research question has been whether there is a genetic reason women are more likely than men to develop depression.
In 2025, a large study revealed substantial overlap between men and women’s genetic risk. However, on average, women with depression tend to carry more of the genetic variants linked to depression.
This suggests that there may be a greater genetic risk for depression in women and perhaps a stronger environmental influence on depression risk in men.
Still, carrying a genetic risk does not mean someone will necessarily develop depression. The interplay between genetic and non-genetic factors is complex.
Hormones and biological sex
Hormones – the body’s chemical messengers – also play an important role in mood and wellbeing.
In women, estrogen and progesterone levels naturally fluctuate across different life stages, including the menstrual cycle, pregnancy, the period after childbirth and menopause.
Our 2025 review found some women are more sensitive to these normal hormonal shifts, and more vulnerable to mood disturbances.
For instance, in the premenstrual phase of their cycle, around 8% of women experience a severe depression, with intense mood swings and irritability, called premenstrual dysphoric disorder.
Similarly, the dramatic hormonal changes during pregnancy and after childbirth (combined with sleep loss and stress) can contribute to postnatal depression.
Later in life, fluctuating and falling estrogen levels during the menopause transition years may also increase the risk of developing depressive symptoms or intensify existing ones.
Hormonal contraceptives – which contain synthetic forms of estrogen and progesterone – have also been linked to mood changes and depression symptoms. In fact, these are some of the most common reasons women stop taking them.
These findings show how hormones can act as biological triggers, and help explain why women are statistically more likely to experience depression at certain stages of life.
The effect of hormones on depression in men has predominantly focused on the protective role of testosterone, but findings remain inconclusive.
When we experience stress, our bodies activate the hypothalamic–pituitary–adrenal (HPA) axis, also known as the “stress-response system”. This helps us cope by maintaining balance in our body – what scientists call physiological homeostasis.
But when stress is constant or overwhelming, this system can become dysregulated. Stressful or traumatic experiences in childhood – such as neglect, abuse or severe adversity – can also disrupt the stress-response system.
As a result, we overproduce the stress hormone cortisol. High or persistent cortisol levels can alter the structure and functioning of key brain areas (the hippocampus and pre-frontal cortex) which are important for regulating mood and memory.
Cortisol can also trigger the release of inflammatory chemicals, which then cross into the brain or influence neural signals, leading to mood changes and depressive symptoms.
Importantly though, not everyone who experiences stressful life events becomes depressed.
Some people may be more vulnerable due to genetic factors, early life adversity or differences in brain chemistry. Others might cope with the same stress without developing depression or other conditions.
Does personality play a role?
Personality traits also influence how people respond to stress and may affect their risk of developing depression.
People who tend to experience anxiety, sadness and self-doubt are more likely to develop depressive symptoms, especially after stressful events. In contrast, traits such as resilience, optimism, and emotional stability seem to protect against depression.
This suggests that personality plays an important role in shaping both vulnerability and resilience to depression.
Lifestyle choices can help lower your risk
These include not smoking, limiting alcohol use, eating a balanced diet, staying physically active, getting enough sleep, maintaining a healthy body weight and having social supports.
Research shows these healthy habits and lifestyle factors can have a protective effect on mental health. They may even reduce the impact of genetic risk factors for depression.
There’s no single cause – and no universal treatment
Depression arises from a mix of factors – biological (genes and hormones), psychological (personality and thoughts) and social (stress and life events).
Treatment options are based on all of these factors, as well as considering how severe the depression is and whether a person has responded to previous treatments.
While science has made some progress in understanding depression, what underpins each person’s experience is unique.
Our research with New Zealand families highlights how supporting unstructured play can help adults feel less stressed and more connected, while also normalising playfulness in everyday family life.
In a world that demands constant busyness, play offers essential qualities we are at risk of losing: spontaneity, togetherness and the freedom to have fun.
Play in adulthood can look different from play in childhood. It is less about toys or games and more about how we approach everyday experiences.
Adult play can be physical, social, creative or imaginative. It might involve movement, music, humour, storytelling, problem-solving or simply doing something for the pleasure of it.
What makes an activity playful is not its form, but the mindset behind it: curiosity, openness and a willingness to engage without a fixed outcome. For adults, play is often woven into hobbies and moments of exploration that sit outside work and obligation.
The benefits of play in adult life
A recent study suggests a potential neurobiological pathway between playfulness and cognitive health in older adults.
At its core, play provides a space to reset, allowing us to step outside pressure and performance. In doing so, it supports not only stress regulation, but sustains emotional balance and quality of life across adulthood.
The value of playfulness also goes beyond the individual. Playful engagement in social contexts helps build shared emotional resources, shaping how people interact and cope together over time.
Playfulness in adults is also associated with higher emotional intelligence, including stronger ability to perceive and manage emotions in social situations. Observational studies further show that adults who engage playfully are more empathetic, reciprocal and positive in their interactions with others, reinforcing social connection and belonging.
Importantly, play has a unique ability to cut across age boundaries. When adults and children play together, even if unrelated, differences in age, role and status tend to fade, replaced by shared enjoyment and interaction.
Research suggests these inter-generational play experiences can strengthen relationships, support wellbeing and reduce age-based stereotypes. Play becomes a shared language, bridging age divides that are often reinforced by modern living.
As our work highlights, unstructured play remains both possible and meaningful in contemporary life, with families reporting benefits for children’s development as well as family cohesion and shared wellbeing. These findings suggest play can function as an ordinary, rather than exceptional, feature of family and community life.
Making room for play in everyday life
If play matters across the lifespan, the spaces we inhabit need to support it.
Yet most public environments continue to treat play as something designed primarily for children. Research in urban design suggests the most effective playful environments for adults are those that don’t announce themselves as playgrounds, but instead embed playful possibilities into everyday settings.
Features such as oversized steps, stepping stones, interactive seating or winding paths can invite exploration, balance and movement. In some cities, this extends to adult-sized play elements integrated into public space, such as musical swings that turn routine movement into playful interaction.
Despite these examples, play-oriented design remains the exception rather than the norm, with most public play infrastructure still concentrated in children’s spaces. Designing cities that invite adult play as part of everyday life could be a valuable investment in inclusion, social connection and population wellbeing.
Environments that support play are not just physical, but social. Just as urban design can invite or discourage playful movement, social norms shape whether play feels acceptable in adult life.
When play is treated as embarrassing, indulgent or something to apologise for, it quickly disappears. But when playful behaviour is visible and unremarkable, it becomes easier for others to participate.
Play has long been treated as something separate from adult life, confined to childhood or reserved for rare moments of leisure. Yet the evidence suggests playfulness continues to matter well beyond early development.
Reframing play as a legitimate part of adult life opens up new ways of thinking about wellbeing across the lifespan.
If you go to the gym often, you might have been told you shouldn’t lift weights in runners.
The common belief is it is bad for your performance and can lead to injuries.
But is this really the case? Let’s unpack the science.
What your feet are doing when you lift
Your feet are key to exercising safely and effectively.
When you walk and run, they act like a springs and help propel you forward with each step. Your feet also help you maintain balance by supporting your weight.
When you lift any amount of weight (for example, doing compound exercises such as squats) your feet are working hard to keep you stable – even if you’re not thinking much about them.
Researchers have also suggested having a stable foot helps you push more efficiently into the ground. This may increase the amount of weight you can safely lift.
But what you wear on your feet may also contribute to this.
Can’t I just wear runners?
Unsurprisingly, given their name, running shoes are designed specifically to improve your performance and protect your feet while running.
They generally have a raised heel, a thick, cushioned sole to absorb shock, and a “rocker” shape that helps you roll from your heel to your toe. These features help reduce the impact of running on your body.
But in the gym, this cushioned sole may absorb the force you create when lifting weights, making you feel less stable, strong, and powerful. This is likely why some people may say you shouldn’t lift weights in running shoes.
Some people may be concerned this can lead to weightlifting injuries.
One 2016 study found wearing running shoes for exercises like squats can change how your ankle and knee joints move. But there is no peer-reviewed evidence linking these changes to injury.
Weightlifting shoes may help you perform certain gym exercises.Victor Freitas/Pexels
What are my other options?
Aside from running shoes, there are three other shoe types people generally wear while lifting weights: minimalist (sometimes called “barefoot”), flat or weightlifting shoes.
Minimalist shoes are designed to simulate being barefoot. They have thin soles with almost no cushioning, and aim to let the foot interact with the ground as if you were not wearing shoes at all. Flat sneakers designed for casual wear, such as Vans or Converse, also have thin soles without cushioning.
As a result, these types of shoes may be a good choice for lifting weights because they will be more stable than runners.
In contrast, weightlifting shoes are designed to improve how you perform in the gym.
They typically have a raised heel and a solid, stiff sole without any give, often made of wood or hard plastic. This helps you stay stable at the bottom of a deep squat, which is particuarly useful for movements such as squats, cleans and snatches.
But how do these different shoes stack up?
Studies looking at the impact of footwear on gym performance is largely limited to the squat and deadlift, probably because these are focused on leg strength.
One study from 2020 comparing running and weightlifting shoes found the latter helped people squat with a more upright torso and more flexibility in their knees.
This can take stress off the lower back and make your leg muscles work harder, which is the main purpose of the exercise.
Similarly, research from 2016 showed people wearing weightlifting shoes felt more stable when squatting. This suggests they may be a better option for that specific exercise.
A 2018 study focused on people performing deadlifts. It found running shoes reduced how quickly people could push force into the ground compared to when they wore only socks. This may suggest that they were more stable without running shoes.
However, this difference was small and has not been consistently replicated in other studies.
So what shoes should I wear?
That ultimately depends on your personal goals and situation.
Weightlifting shoes might be your best bet when doing squats. But if you mainly stick to deadlifts, flat shoes may slightly boost your performance. That is if your goal is to lift as much weight as possible.
However, if you are an Olympic weightlifter who needs to get into a deep squat position for competition, weightlifting shoes are the ideal option.
For everyone else, what shoes you wear may not matter as much. So wear whatever is most comfortable and keep lifting those weights.
The Conversation fact-checks claims made on Q&A, broadcast Mondays on the ABC at 9.35pm. Thank you to everyone who sent us quotes for checking via Twitter using the hashtags #FactCheck and #QandA, on Facebook or by email.
Excerpt from Q&A, July 30, 2018.
…we don’t hear enough about the fact under the current government we have had net debt double.
– Shadow minister for finance Jim Chalmers, speaking on Q&A, July 30 2018
As the government and opposition seek to establish their economic credentials in the lead-up to the next federal election, we can expect to hear plenty about the relative performances of the Coalition and Labor Party with regard to government deficits and debt.
On ABC Television’s Q&A, shadow minister for finance Jim Chalmers claimed that “under the current government, we have had net debt double”.
Is that right?
Checking the source
In response to The Conversation’s request, a spokesperson for Chalmers provided the following sources:
According to the government’s Monthly Financial Statements, in September 2013 (the month of the 2013 federal election), net debt was under A$175 billion (A$174,577m).
Also, on the government’s own budget numbers, net debt for this financial year is A$349.9 billion (2018-19 Budget, BP1 3-16, Table 3).
So whether you look at the government’s Monthly Financial Statements or its budget, we’ve had net debt double under this government.
Chalmers told The Conversation:
The Liberals used to bang on about a so-called “budget emergency” and a “debt and deficit disaster”, but you don’t hear a peep from them anymore.
Not only has net debt doubled on the Liberals’ watch, but gross debt has crashed through half-a-trillion dollars for the first time ever, and their own budget papers expect it to remain well above half-a-trillion dollars every year for the next decade.
Verdict
Shadow minister for finance Jim Chalmers quoted his numbers (broadly) correctly when he said that “under the current government we have had net debt double”.
As at July 1 2018, the budget estimate of net debt in Australia was about A$341.0 billion, up from A$174.5 billion in September 2013, when the Coalition took office. That’s an increase of A$166.5 billion, or roughly 95%, over almost five years.
To put that in context, in Labor’s last term (2007-13, a nearly six-year period that included the Global Financial Crisis), net debt rose by about A$197 billion – around A$30 billion more than has been the case under the current Coalition government.
It’s worth remembering that over time, a government’s debt position will reflect deficits (or surpluses) of past governments.
What is ‘net debt’?
Gross debt is the total amount of money a government owes to other parties. Net debt is gross debt, adjusted for some of the assets a government owns and earns interest on.
Not all government assets are included in the calculation of net debt. For example, the equity holdings of Australia’s sovereign wealth fund – the Future Fund – are excluded.
It’s worth noting that net debt doesn’t give the full picture of a government’s balance sheet.
If the government borrows A$1 (by issuing bonds) to buy A$1 worth of equity (investment in another asset), net debt will rise. That’s because bond issuance (debt) will rise by A$1, without an accompanying increase in investments that pay interest.
In Australia’s case, this distinction is relevant, because the government currently has about A$50 billion of investments in shares (which aren’t considered interest-bearing for accounting purposes) and around A$50 billion in equity in public sector entities (like schools, hospitals and infrastructure).
Over time, a government’s debt position will reflect deficits of past governments, with budget deficits increasing the total debt, and surpluses reducing it.
Has net debt doubled under the current government?
The chart below shows net debt for Australia from 2001-02 to 2018-19. The 2017-18 and 2018-19 numbers are estimates, but all earlier numbers are actual net debt numbers.
As you can see from the chart, net debt has risen under both Coalition and Labor governments since 2008.
On July 1 2007, in the final year of the Howard Coalition government, net debt was minus A$24.2 billion. The government’s financial assets, such as those held in the Future Fund, were greater than government bonds on issuance, putting the government in a net asset (positive) position.
At the time of the election of the Labor government in November 2007, Australia’s net debt position was still negative (at minus A$22.1 billion) – meaning the government held A$22.1 billion more than it owed. By July 1 2013, in the final months of the last Labor government, net debt had risen to A$159.6 billion.
The Liberal-National Coalition won the federal election on September 7 2013. At September 30, net debt was A$174.5 billion (meaning that net debt rose by about A$5 billion per month in the three months before the 2013 election).
As at July 1 2018, the budget estimate of net debt in Australia was about A$341.0 billion. That’s roughly a 95% rise since the Coalition took office in 2013, making Chalmers’ statement about net debt having doubled under the current government broadly correct.
What can we take from this?
In terms of economic management, not a great deal.
Rather than being concerned about the level of debt, most economists would be concerned about the level of debt relative to gross domestic product (GDP), or the size of the population. On these measures, the rises in net debt under the current government have been less significant.
Let’s take the net-debt-to-GDP ratio.
It rose from about 11.3% in September 2013 (when the Coalition was elected) to 18.3% in July 2016, at which point the ratio roughly stabilised. The net debt to GDP ratio now stands at 18.6% and is predicted to fall in the next few years.
It’s also worth noting that during Labor’s most recent period of government, net debt rose by around A$197 billion – about A$30 billion more than has been the case under the current Coalition government.
My research on the effects of political parties in Australia on the economy found that, historically, economic growth and other important economic outcomes have had little to do with which party is in power. – Mark Crosby
Blind review
The author has a done a very competent job in analysing Jim Chalmers’ statement regarding net debt under the current government.
What the analysis shows is how complex the issue is, and that the argument over which major party is the better economic manager cannot be encapsulated simply by one number.
The net debt figures can be interpreted in a number of different ways, pointing to different assessments of a particular government’s economic management.
As the author notes, the net debt position depends not just on the current government’s actions, but also on the legacy inherited from previous governments. That’s because debt is used to finance borrowings, which are largely the result of previous governments’ fiscal policies.
An assessment of a government’s macro-economic management depends on analysis of several different factors, of which debt is only one. – Phil Lewis
The Conversation FactCheck is accredited by the International Fact-Checking Network.
The Conversation’s FactCheck unit was the first fact-checking team in Australia and one of the first worldwide to be accredited by the International Fact-Checking Network, an alliance of fact-checkers hosted at the Poynter Institute in the US. Read more here.
Have you seen a “fact” worth checking? The Conversation’s FactCheck asks academic experts to test claims and see how true they are. We then ask a second academic to review an anonymous copy of the article. You can request a check at checkit@theconversation.edu.au. Please include the statement you would like us to check, the date it was made, and a link if possible.
Source: The Conversation (Au and NZ) – By Adrian Beaumont, Honorary Associate, School of Mathematics and Statistics, The University of Melbourne
This year [Pauline Hanson] has voted effectively 100% of the time with the Turnbull government. Honestly you may as well vote LNP if you are voting One Nation because there is no difference.
– Deputy opposition leader Tanya Plibersek, doorstop interview, Caboolture, Queensland, July 10, 2018
In recent weeks, senior Labor Party figures have sought to draw attention to the voting patterns of Pauline Hanson’s One Nation party, arguing that a vote for the minor party is a vote for the Coalition.
At the Labor campaign launch in the Queensland seat of Longman ahead of Saturday’s crucial byelections, opposition leader Bill Shorten said it’s “a fact that if you vote One Nation, you are voting [Liberal National Party]. You are not protesting, you are being used to send a vote to the LNP.”
On the same day, shadow finance minister Jim Chalmers described One Nation as “the wholly-owned subsidiary of Malcolm Turnbull’s Liberal Party”.
Earlier this month, deputy opposition leader Tanya Plibersek said that in 2018, Pauline Hanson had “voted effectively 100% of the time with the Turnbull Government”.
Let’s look at the records.
Checking the source
In response to The Conversation’s request for sources and comment, Tanya Plibersek said:
Pauline Hanson voted with the Liberals to cut school funding and voted to cut family benefits while she voted herself a massive $7,000 a year tax cut. Australian voters deserve to know the truth about Hanson’s voting record in Canberra.
Plibersek’s office highlighted 20 such votes in 2018 in which Labor and the Coalition disagreed. Of those, Hanson abstained from one vote, and voted 18 times with the government. (The equivalent of 95% of the time, with the abstention excluded.)
A spokesperson told The Conversation Plibersek used the qualifier “effectively” in her original comment to indicate that Hanson voted with the Coalition almost all of the time.
Verdict
Deputy opposition leader Tanya Plibersek said Pauline Hanson has “voted effectively 100% of the time with the Turnbull Government” in 2018.
Parliamentary records show the figure to be between 83-86%, depending on the measure used.
Pauline Hanson’s One Nation party has cast 169 formal votes in the Senate to date in 2018. Of those, it was in agreement with the government 83% of the time.
If we look at the 99 occasions where the government and opposition were in disagreement, and One Nation cast an influential vote, we see that the minor party voted with the government 86% of the time.
Voting in the Senate
Votes in the Senate can be determined “on the voices” or “by division”.
For a vote to pass on the voices, a majority of senators must call “aye” in response to the question posed by the chair.
If two or more senators challenge the chair’s conclusion about whether the “ayes” or “noes” are in the majority, a division is called.
Bells are then rung for four minutes to call senators to the chamber. The question is posed again, and senators vote by taking their place on the right or left hand side of the chair, before the votes are counted by tellers.
Voting records are only published for votes passed by division.
Pauline Hanson’s One Nation Party is represented in the parliament by party leader and Queensland senator Pauline Hanson, and West Australian senator Peter Georgiou. New South Wales senator Brian Burston was a One Nation senator until June 2018.
Plibersek’s comment referred to votes on the second and third readings of legislation in the full Senate, excluding procedural votes, motions and votes in Senate committees.
But votes that take place in Senate committees, after the second reading, but before the third, are also important. Much of the legislative process is done “in committee”, where various parties propose amendments to legislation, and these are voted on.
So counting only the full Senate votes on legislation as being significant, as Plibersek did, does not give the full picture.
In this FactCheck, I will consider all the divisions, from a number of different angles.
There have been 187 divisions in the Senate so far this year. Of those, One Nation:
voted with the Coalition on 141 occasions (or 75% of the time)
voted against the Coalition on 28 occasions (or 15% of the time), and
abstained from voting on 18 occasions (or 10% of the time).
Of the 169 divisions where One Nation voted, it was in agreement with the government 83% of the time.
But it’s important to consider the balance of power.
When the Coalition and Labor vote the same way, minor party votes do not affect the outcome. When the Coalition and Labor are in disagreement, minor party votes are all important.
There have been 110 such divisions between the Coalition and Labor in the Senate in 2018 to date.
In these 110 divisions, One Nation:
voted with the Coalition on 85 occasions (or 77% of the time)
voted against the Coalition on 14 occasions (or 13% of the time), and
abstained from voting on 11 occasions (10% of the time).
If we look at the 99 divisions where the Coalition and Labor were in disagreement, and One Nation cast an influential vote, we see that the party voted with the Coalition 86% of the time.
By comparison, in the 110 divisions where Labor opposed the government, the Australian Greens supported the Coalition 5% of the time, and the Centre Alliance (formerly Nick Xenophon Team) did so 56% of the time.
The calculations for the Greens and Centre Alliance above do not include abstentions and cases where the party vote was split. – Adrian Beaumont
Blind review
The author’s points and statistics appear to be all in order.
As the FactCheck shows, while One Nation has not voted with the government 100% of the time, it has supported the Coalition in a large majority of cases. – Zareh Ghazarian
The Conversation FactCheck is accredited by the International Fact-Checking Network.
The Conversation’s FactCheck unit was the first fact-checking team in Australia and one of the first worldwide to be accredited by the International Fact-Checking Network, an alliance of fact-checkers hosted at the Poynter Institute in the US. Read more here.
Have you seen a “fact” worth checking? The Conversation’s FactCheck asks academic experts to test claims and see how true they are. We then ask a second academic to review an anonymous copy of the article. You can request a check at checkit@theconversation.edu.au. Please include the statement you would like us to check, the date it was made, and a link if possible.