

Source: The Conversation – UK
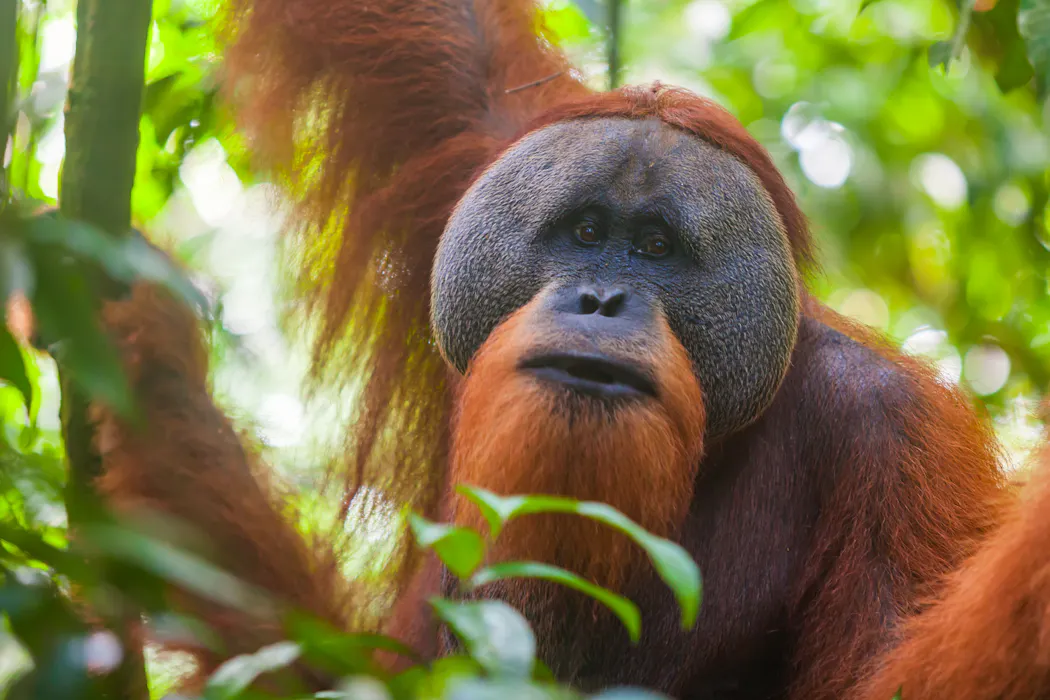
Wildlife populations around the world have declined by an average of 73% since 1970. That’s according to the WWF’s new 2026 Living Planet Index – a major estimate, updated every two years, of the changing state of nature. This does not mean that 73% of the world’s animals have disappeared. Rather, it is the average decline in the size of wildlife populations that is being monitored.
The index is one of the metrics used to track progress towards the UN’s biodiversity goals and shapes narratives of biodiversity loss across the world. But the data behind that 73% headline, one of the most comprehensive available, is still far from complete.
Very few, outside of those of us working at the coalface of handling biodiversity data, understand just how poorly wild animal populations are monitored. Though the world faces the joint crises of climate change and biodiversity loss, we can track climate change through thousands of weather stations or measures of atmospheric CO₂. Biodiversity is far harder to measure. Counting wildlife is highly resource intensive, generally can’t be done from space, and systematic monitoring is extremely patchy.
What this means is that, relative to the data we do possess, there are far, far more wildlife populations that no one is counting.
Though initiatives are seeking to address this, it will be years before they will produce outcomes. And we still have the issue of historic data gaps, that is, we cannot travel back in time to count populations of the past. This means the Living Planet Index and similar efforts to track how wildlife is changing must rely on whatever data is available. These come from ad hoc academic studies, patchy monitoring programmes, and management data for harvested species.
Some critiques of the index have focused on the fact that when these records are taken at face value, roughly the same number of populations are increasing as decreasing. Similar patterns are observed in one of the other biggest collections of population change data, BioTIME.
So why does the Living Planet Index show such a strong overall decline? One reason is that the populations we have data for are not necessarily representative of wildlife populations as a whole.
The wildlife we count is not a random sample
For example, the Living Planet Index is biased towards counts from protected areas, and preliminary analysis from our team indicates both it and BioTIME contain a disproportionate number of counts in areas of mostly undisturbed habitat – such as remote wilderness or national parks.

Hari Gopalakrishnen / shutterstock
In other words, most of the information we possess about wildlife change worldwide could be from areas where we would hope biodiversity is doing okay. This might explain the balance of declining and increasing populations in the raw data. If we don’t account for this, we risk making major underestimates of how much biodiversity is declining.
Though there do tend to be “winners” from habitat loss or change, such as farmland birds that thrive after a forest is converted to agriculture, many instances of habitat loss result in far more populations declining than increasing, like conversions of tropical forest to monoculture plantations, or grasslands to towns or cities.
But the bias could also work in the other direction. The Living Planet Index might be more likely to have data on threatened species, or on species harvested by humans (such as fish). These are all species we might expect to be declining. The truth is, we don’t fully understand all the ways in which the wildlife counts we have could be biased, or how this could affect what we know.
How scientists are trying to fill the gaps
The Living Planet Index takes steps to address bias by giving greater importance to counts from under-sampled regions such as Africa and South America.
There, the loss of undisturbed habitat is greater and there are far more species, so giving their population counts greater relative importance is a coarse way to balance some bias. It also includes data collected over very short periods – sometimes just two time points.
This sparseness comes with uncertainty about population trends, but excluding these populations would leave the index with even less data and make its underlying biases worse.
More sophisticated methods to understand bias in biodiversity science are in their infancy, and scientists are working hard to develop tools and make indicators more accurate. In the meantime, anyone interpreting the Living Planet Index must remember that the task presented to teams developing biodiversity indicators is twofold: not only to analyse existing data in rigorous ways but also to make adjustments so that the data itself is as representative as possible of the real world.
Getting this right is a phenomenally difficult task, especially for global indicators like the Living Planet Index, which have to produce a single narrative that summarises the great diversity of wildlife changes happening across the planet. As new methods emerge, scientists will work to ensure that the story told of global biodiversity loss is as accurate as possible.

The authors do not work for, consult, own shares in or receive funding from any company or organisation that would benefit from this article, and have disclosed no relevant affiliations beyond their academic appointment.
Original source: https://analysis1.mil-osi.com/2026/10/08/wildlife-populations-have-declined-73-since-1970-but-many-of-the-worlds-animals-still-arent-being-counted/