Source: The Conversation (Au and NZ) – By Adrian Dyer, Associate Professor, Monash University
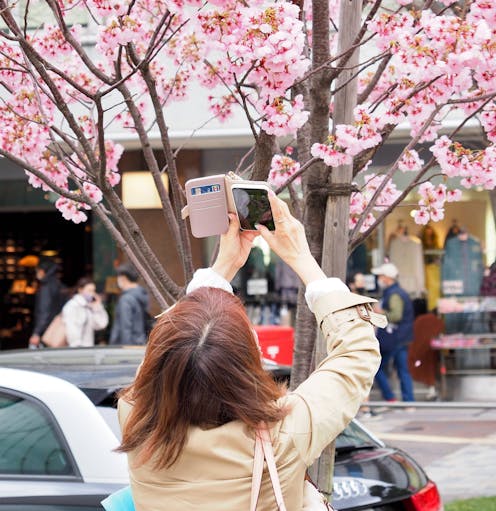
Social media contains enormous amounts of data about people, our everyday lives, and our interactions with our surroundings. As a byproduct, it also contains a vast trove of information about the natural world.
In a new study published in Flora, we show how social media can be used for “incidental citizen science”. From photos posted to a social site, we mapped countrywide patterns in nature over a decade in relatively fine detail.
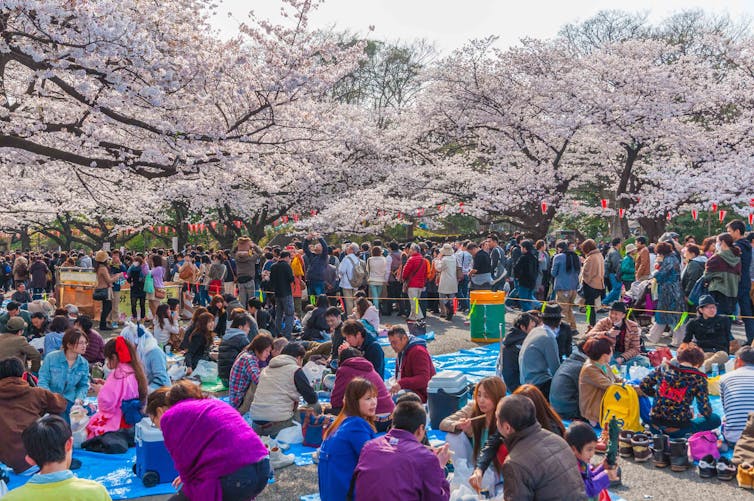
Our case study was the annual spread of cherry blossom flowering across Japan, where millions of people view the blooming each year in a cultural event called “hanami”. The flowering spreads across Japan in a wave (“sakura zensen” or 桜前線) following the warmth of the arriving spring season.
Shutterstock
The hanami festival has been documented for centuries, and research shows climate change is making early blossoming more likely. The advent of mobile phones – and social network sites that allow people to upload photos tagged with time and location data – presents a new opportunity to study how Japan’s flowering events are affected by seasonal climate.
Why are flowers useful to understand how nature is being altered by climate change?
Many flowering plants, including the cherry blossoms of Japan (Prunus subgenus Cerasus), require insect pollination. To reproduce, plant flowers bloom at optimal times to receive visits from insects like bees.
Temperature is an important mechanism for plants to trigger this flowering. Previous research has highlighted how climate change may create mismatches in space or time between the blooming of plants and the emergence of pollinating insects.
It has been difficult for researchers to map the extent of this problem in detail, as its study requires simultaneous data collection over large areas. The use of citizen science images deliberately, or incidentally, uploaded to social network sites enables big data solutions.
How did we conduct our study?
We collected images from Japan uploaded to Flickr between 2008 and 2018 that were tagged by users as “cherry blossoms”. We used computer vision techniques to analyse these images, and to provide sets of keywords describing their image content.
Next, we automatically filtered out images appearing to contain content that the computer vision algorithms determined didn’t match our targeted cherry blossoms. For instance, many contained images of autumn leaves, another popular ecological event to view in Japan.
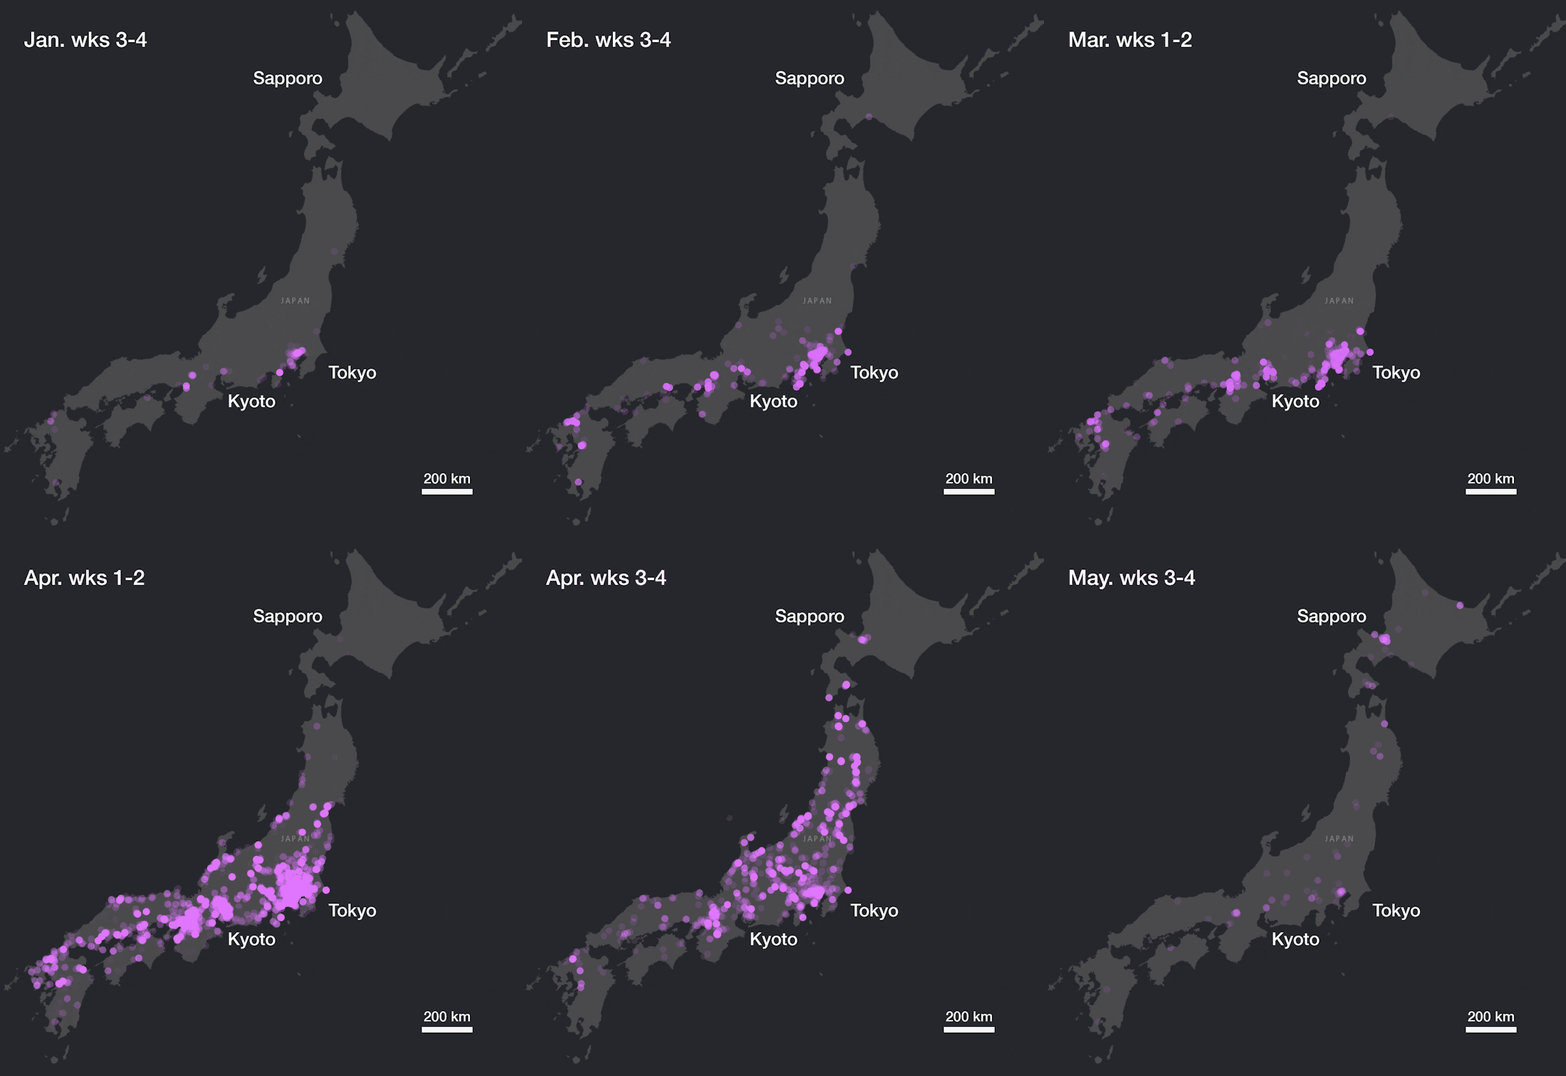
The locations and timestamps of the remaining cherry blossom images were then used to generate marks on a map of Japan showing the seasonal wave of sakura blossoms, and to estimate peak bloom times each year in different cities.
Checking the data
An important component of any scientific investigation is validation – how well does a proposed solution or data set represent the real-world phenomenon under study?
ElQadi et al., Author provided
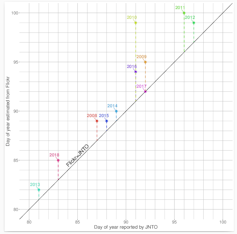
Our study using social network site images was validated against the detailed information published by the Japan National Tourism Organization.
We also manually examined a subset of images to confirm the presence of cherry flowers.
Plum flowers (Prunus mume) look very similar to cherry blossoms, especially to tourists, and they are frequently mistaken and mislabelled as cherry blossoms. We used visible “notches” at the end of cherry petals, and other characteristics, to distinguish cherries from plums.
Taken together, the data let us map the flowering event as it unfolds across Japan.
ElQadi et al., Author provided
Out-of-season blooms
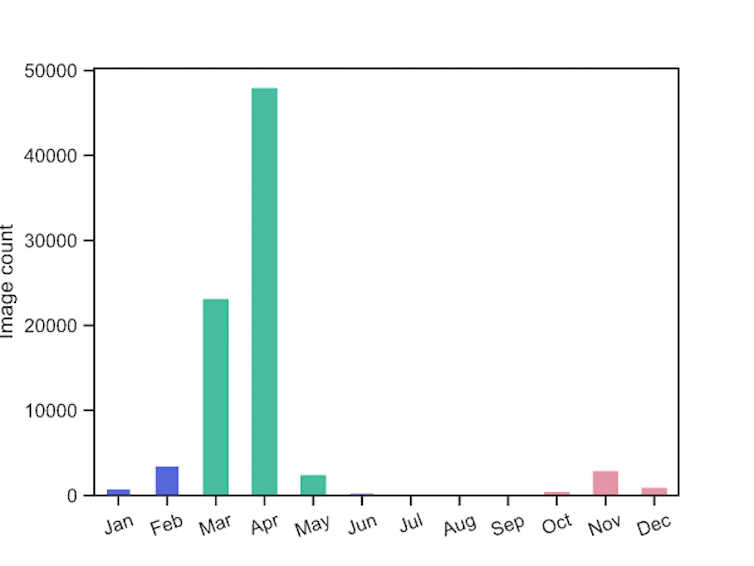
Our social network site analysis was sufficiently detailed to accurately pinpoint the annual peak spring bloom in the major cities of Tokyo and Kyoto, to within a few days of official records.
Our data also revealed the presence of a consistent, and persistent, out-of-season cherry bloom in autumn. Upon further searching, we discovered that this “unexpected” seasonal bloom had also been noted in mainstream media in recent years. We thus confirmed that this is a real event, not an artefact of our study.
ElQadi et al., Author provided
So, even without knowing it, many of us are already helping to understand how climate change influences our environment, simply by posting online photographs we capture. Dedicated sites like Wild Pollinator Count are excellent resources to contribute to the growing knowledge base.
The complex issues of climate change are still being mapped. Citizen science allows our daily observations to improve our understanding, and so better manage our relationship with the natural world.
![]()
Adrian Dyer receives funding from The Australian Research Council, and the Alexander von Humboldt Foundation (Germany).
Alan Dorin receives funding and/or support from the Australian Research Council, AgriFutures, Costa Group, Australian Blueberry Growers Association and Sunny Ridge berries.
Carolyn Vlasveld was undertaking a PhD at Monash University while collaborating on the study mentioned in this article. Her PhD was financially supported by an Australian Government Research Training Program (RTP) Scholarship, a Monash University Graduate Research Completion Award, an Ecological Society of Australia (ESA) Student Scholarship, a Denis and Maisie Carr Award and Travel Grant, and an Australian Society of Plant Scientists RN Robertson Travelling Fellowship.
Moataz ElQadi worked on this project as part of his PhD where he was supported by an Australian Government Research Training Program (RTP) scholarship and a Monash university stipend. Moataz also received an AI for Earth grant from Microsoft.
– ref. Social media snaps map the sweep of Japan’s cherry blossom season in unprecedented detail – https://theconversation.com/social-media-snaps-map-the-sweep-of-japans-cherry-blossom-season-in-unprecedented-detail-206574


