Source: The Conversation (Au and NZ) – By Carly Tozer, Senior Research Scientist, CSIRO

Dean Lewins/AAP
La Niña and El Niño are well-known terms in Australia these days. Linked to them are certain expectations: we expect wet conditions in La Niña and dry conditions in El Niño.
These expectations have certainly been met over the past couple of years, when regions across Australia experienced record-breaking rains and severe floods during consecutive La Niña events.
It might surprise you to learn, however, that not all La Niñas have been wet, nor El Niños dry. Step back to spring 2020, for example, and Australia was relatively dry and warm, despite a La Niña.
Officials have declared the recent La Niña as over, and now we’re on an El Niño watch. You might therefore be wondering: how often can we expect it to be dry in Australia during El Niño? Our new research sought to answer this question, and the converse for La Niña.
We found La Niña and El Niño are good indicators of wet and dry conditions in eastern Australia as a whole. But at some locations, including Sydney, they do little to shift the normal odds of wet and dry conditions.
Eugene Tan/AAP
What we did
We focused on the spring season because spring rainfall has the strongest historical relationship with La Niña/El Niño. We used a simple approach known as “tercile analysis”.
First, we ordered the past 72 years of rainfall data from the wettest spring to the driest. We then split the data into thirds. Springs with rainfall totals in the bottom third are considered “dry”; springs in the middle third are considered “average”; and springs with rainfall totals in the top third are “wet”.
Splitting the data in this way means we can say that any spring normally has a 33% chance of being dry, 33% chance of being average and 33% chance of being wet. Our aim was to see if these “normal” odds change during El Niño and La Niña events.
Read more:
The flap of a butterfly’s wings: why autumn is not a good time to predict if El Niño is coming
Do La Niña and El Niño change rainfall odds in eastern Australia?
For rainfall averaged across eastern Australian states, the short answer is yes.
The figure below shows the rainfall data split into wet, average and dry boxes and also La Niña, neutral and El Niño boxes. If La Niña and El Niño did not change the rainfall odds, we would expect to see an even number of dots spread across all the boxes. However, this is not the case.
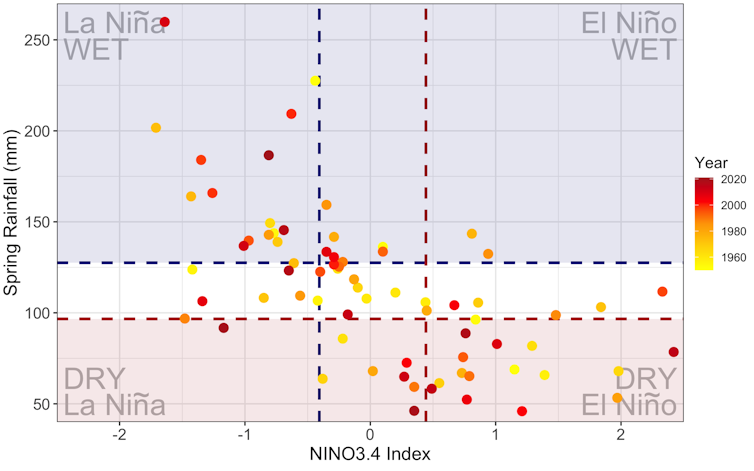
The almost empty “dry” box in La Niña and “wet” box in El Niño show very low odds in eastern Australia of experiencing dry conditions in La Niña or wet conditions in El Niño. On the other hand, La Niña approximately doubles the normal 33% chance of experiencing wet conditions and El Niño doubles the chance of dry conditions.
This result is helpful in setting broad expectations across eastern Australia. But it doesn’t necessarily apply in all locations, as we discuss below.
What about individual locations?
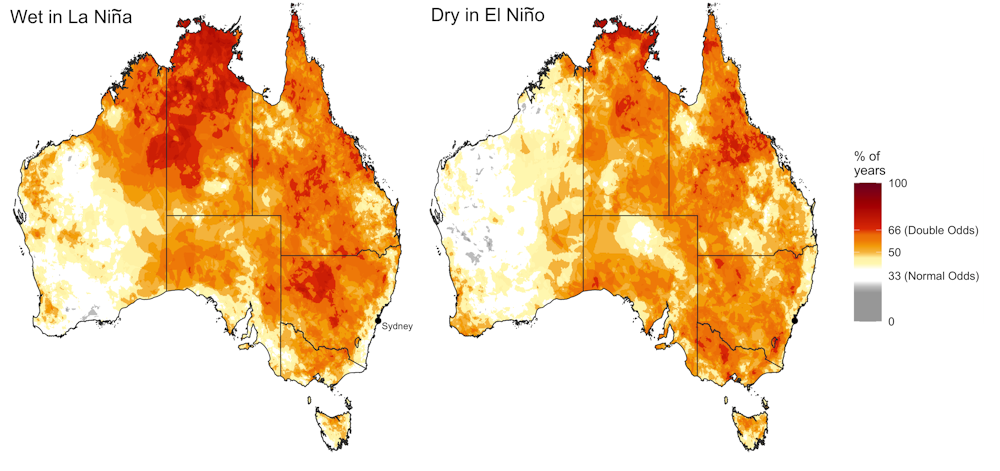
We applied the analysis approach described above to 5km grids across Australia.
For parts of northern and southeastern Australia, including the Murray-Darling Basin, La Niña and El Niño significantly increase the normal odds of wet and dry springs respectively (orange and red areas).
But in some places, La Niña and El Niño do not markedly change the normal odds of wet or dry conditions. These locations include large parts of Western Australia, southwestern Tasmania, and southern and eastern coasts of mainland Australia, including the eastern seaboard (yellow and white areas).
The eastern seaboard is the easternmost part of Australia, between the east coast and the Great Dividing Range. The seemingly weak relationship between La Niña and El Niño and the eastern seaboard might seem surprising. After all, just consider the large amount of rain that’s fallen on the east coast over the past couple of years during La Niña, including Sydney’s record-breaking 2022.
Historically, though, rainfall on the eastern seaboard has had a weak relationship with La Niña and El Niño. Why? Because the rainfall in this region is particularly sensitive to the frequency with which the local winds blow from the east to west. But that wind flow is not necessarily strongly linked to La Niña.
In 2022 there were more of these east-to-west wind-flow events than usual, resulting in high rainfall in Sydney.
In the Sydney region, the normal chance of experiencing a wet spring is 33% – and this increases only slightly in a La Niña to 38%. It suggests La Niña is not a strong indicator for wet conditions in this region.
Author provided
When you’re expecting an El Niño, location matters
The declaration of an El Niño watch this early in the year carries considerable uncertainty. But it’s still got people thinking about the possibility of dry conditions.
The odds of experiencing dry conditions in El Niño, however, change according to where you’re located in Australia.
In the above-right map, regions in orange and red could expect an increased chance of dry conditions. Regions in red are very likely to be dry, based on historical relationships. The chance of a dry spring is around normal (33%) in other regions.
Of course, while El Niño plays a large role in moderating Australia’s climate, it is not the only driver of dry conditions in Australia. Processes including the Indian Ocean Dipole, Southern Annular Mode and other related or unrelated weather systems all contribute to Australia’s climate variability.
So it’s important to consider these factors, as well as your specific location in Australia, when interpreting what an El Niño forecast means for you.
Read more:
On our wettest days, stormclouds can dump 30 trillion litres of water across Australia
![]()
Nandini Ramesh has previously received funding from the Australian Research Council, the US Department of Energy, and NASA. She is a Research Affiliate at the The University of Sydney.
Carly Tozer does not work for, consult, own shares in or receive funding from any company or organisation that would benefit from this article, and has disclosed no relevant affiliations beyond their academic appointment.
– ref. What to expect when you’re expecting an El Niño (the answer might surprise you) – https://theconversation.com/what-to-expect-when-youre-expecting-an-el-nino-the-answer-might-surprise-you-198510