Source: The Conversation (Au and NZ) – By Melanie Davern, Associate Professor, Director Australian Urban Observatory, Centre for Urban Research, RMIT University

Australian cities are slowly recovering from the COVID pandemic. Travel across cities is almost back to pre-pandemic levels. Google Mobility show only a 14% drop in travel to work across Victoria and 12% drop across New South Wales compared to pre-COVID results.
However, the disruption of COVID will reverberate through transport planning for years to come. The 2021 census – when people were asked about how they got to work – coincided with COVID lockdowns in our two biggest cities. The distortion of commuting patterns at that time creates problems for anyone who wishes to use these data.
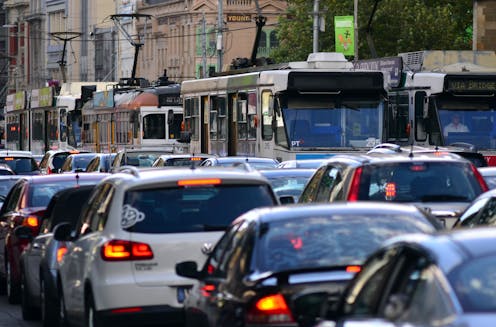
Data on where people work, how they get to work and how far they travel represent a powerful tool for transport planners and policymakers. Transport has a critical influence on the liveability of cities, health, sustainability and quality of life.
So what can we do about these COVID-skewed transport data? In this article we propose some ideas to ensure the census results remain useful for city planning.
Why do the census responses matter?
The Australian Bureau of Statistics runs the census and has collected transport method and workplace data every five years since 1976. In 2016, it improved these data to include distance travelled to work and commuting method.
In that year, 9.2 million commuters travelled an average distance of 16.5km to work. Of these people, 79% used a private vehicle, 14% took public transport and 5.2% cycled or walked. A further 500,000 people worked at home and 1 million employed persons did not go to work on census day.
The level of detail the census provides isn’t available with other methods. This is why the journey-to-work questions are so important.
But many of us were in lockdown in 2021
On census night, Australia’s two biggest cities, Melbourne and Sydney, were in lockdown, as were large regional cities across Victoria, New South Wales and Queensland (and the lockdown in Brisbane had ended only two days before). People were asked: “How did the person get to work on Tuesday 10 August 2021?”
Planners and researchers are expecting some unusual results because of the lockdowns. We don’t know if people recorded their workplace as if the lockdown wasn’t in place, or treated their home as their workplace. While a higher-than-expected number of “worked at home” responses might signal the latter, we can’t know for certain.
The 2021 census data won’t provide a reliable record of “normal” commuting patterns, nor an accurate record of commuting changes over time. It’s not even clear if work attendance and commuting patterns will ever return to their pre-COVID state.
What can we do about the census data?
So the big question is how can decision-makers usefully work with the data to correct for the distortion of COVID lockdowns? We offer the following suggestions.
Look at cities that weren’t in lockdown
One option is to use the broad transport patterns from the least-locked-down parts of Australia, such as Adelaide or Perth. We can use their results and changes in transport mode over time to help estimate the results across other cities.
Link to previous census results
Another option would be to look at previous census results on journey to work for cities and try to match or predict what would have been expected in 2021 for different transport modes and distances. A benefit of this model is that previous results are available at local neighbourhood level and bring in the local influences of transport types and distances.
Another idea would be to look at the occupations that people list on their census forms, then match occupation types to transport modes used in previous census results.
Match to household travel survey data
Transport departments collect household-level travel data across a number of cities including Sydney and Melbourne to understand how far people travel and what transport modes they use. These surveys could be used to model area-based differences in journey-to-work patterns based on more up-to-date commuting results than older census data.
Investigate other travel datasets
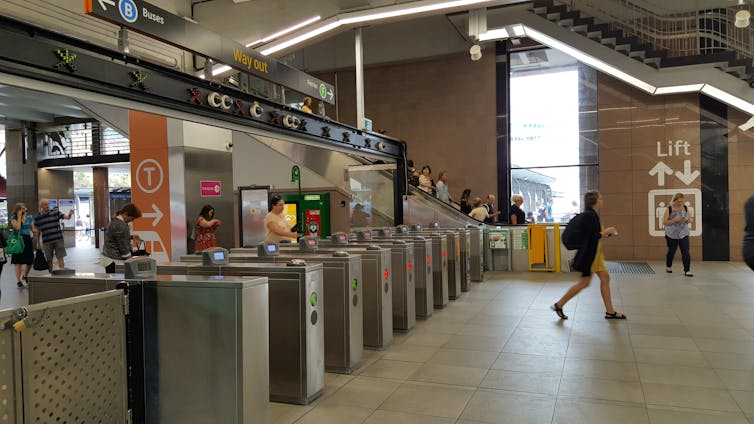
The use of big data has come a long way since 2016. Today we have a number of other public and private travel data sets that could be used. These include Google Mobility results, traffic light counts, road sensors and Myki/Opal/go card travel data.

haireena/Shutterstock
These data sets could be linked or modelled with census results to get a better estimate of results in locked-down areas.
Quarterly and annual COVID surveys could also help to understand how transport has changed throughout the pandemic.
Assess against other government data
Data linkage is another area that the Australian Bureau of Statistics has been working over the years. An example is the Multi-Agency Data Integration Project, which has been designed to help gain further insights from census data. The Australian Tax Office holds employment and work-related vehicle claims that might also be helpful to identify transport modes and travel demands by area.
Strict privacy rules apply to these data, but government agencies working together could lead to better commuting data for cities affected by lockdowns in 2021.
All these options have strengths and weaknesses. None is as good as the complete set of census data unaffected by lockdowns. However, they are worth considering when 2021 journey-to-work results are released on October 12.
Transport planners and researchers are ingenious. They will likely find ways to correct for the above problems to assess and understand transport patterns across Australian cities. Now is the time for discussion and ideas about these issues and the unusual census results to ensure transport planning is based on data that are both sound and up-to-date.
![]()
Melanie Davern receives funding from the National Health and Medical Research Council and funded by RMIT University as a Vice Chancellor’s Senior Research Fellow.
Alan Both receives funding from an NHMRC-UKRI (APP1192788) research grant.
RMIT University receives funding from a range of research and industry organisations for projects on which Jago Dodson works.
Tiebei (Terry) Li does not work for, consult, own shares in or receive funding from any company or organization that would benefit from this article, and has disclosed no relevant affiliations beyond their academic appointment.
– ref. COVID skewed journey-to-work census data. Here’s how city planners can make the best of it – https://theconversation.com/covid-skewed-journey-to-work-census-data-heres-how-city-planners-can-make-the-best-of-it-189071


