Source: The Conversation (Au and NZ) – By Dianne Cook, Professor of Business Analytics, Monash University
As last summer’s horrific bushfires raged, so too did debate about what caused them. Despite the prolonged drought and ever worsening climate change, some people sought to blame the fires largely on arson.
Federal Coalition MPs were among those pushing the arsonist claim. And on Twitter, a fierce hashtag war broke out: “#ClimateEmergency” vs “#ArsonEmergency”.
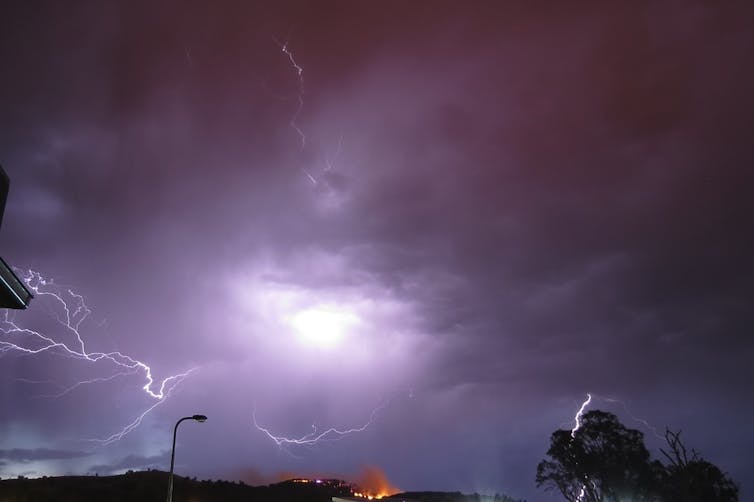
Fire authorities rejected the arson claims, saying most fires were thought to be caused by lightning.
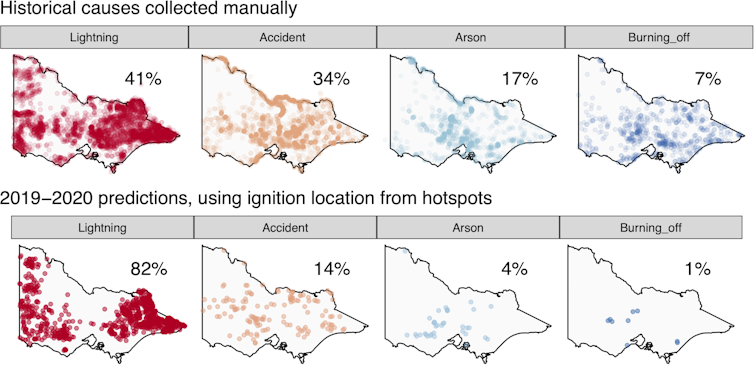
We dug into open data resources to learn more about the causes of last summer’s bushfires in Victoria, and further test the arson claim. Our analysis suggests 82% of the fires can be attributed to lightning, 14% to accidents and 1% to burning off. Only 4% can be attributed to arson.

What we did
We started with hotspots data taken from the Himawari-8 satellite, which shows heat source locations over time and space, in almost real time. We omitted hotspots unlikely to be bushfires, and used a type of data mining called “spatiotemporal clustering” – where time dimension is introduced to geographic data – to estimate ignition time and location.We supplemented this with data from other sources: temperature, moisture, rainfall, wind, sun exposure, fuel load, as well as distance to camp sites, roads and Country Fire Authority (CFA) stations.
Read more: Bushfires, bots and arson claims: Australia flung in the global disinformation spotlight
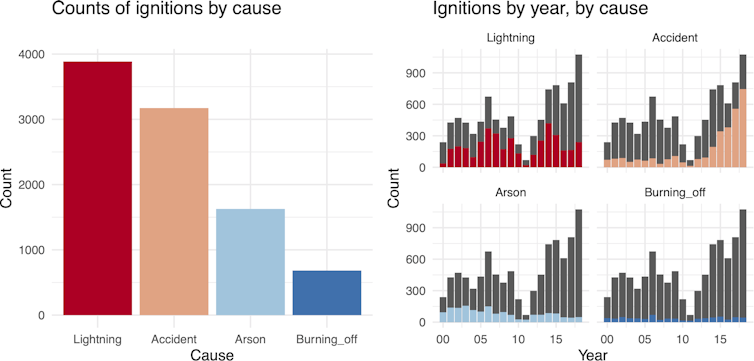
Victoria’s Department of Environment, Land, Water and Planning (DELWP) holds historical data on bushfire ignition from 2000 to the 2018-19 summer. The forensic research required to determine fire cause is laborious, and remotely sensed data from satellites may be useful and more immediate.
By training our model on the historical data, we can more immediately predict causes of last summer’s fires detected from satellite data. (Note: even though we were analysing events in the past, we use the term “predict” because authorities have not released official data.)
DELWP’s data attributes 41% of fires to lightning, 17% to arson, 34% to accidents and 7% to hazard reduction or back burning which escaped containment lines (which our analysis refers to as burning off).

To make predictions for the 2019-20 bushfires, we needed an accurate model for causes in the historical data. We trained the model to predict one of four causes – lightning, accident, arson, burning off – using a machine learning algorithm.
The model performed well on the historical data: 75% overall accuracy, 90% accurate on lightning, 78% for accidents, and 54% for arson (which was mostly confused with accident, as would make sense).
The most important contributors to distinguishing between lightning and arson (or accident) ignition were distance to CFA stations, roads and camp sites, and average wind speed.
As might be expected, smaller distances to CFA stations, roads and camp sites, and higher than average winds, meant the fire was most likely the result of arson or accident. In the case of longer distances, where bush would have been largely inaccessible to the public, lightning was predicted to be the cause.

What we found
Our model predicted that 82% of Victoria’s fires in the summer of 2019-2020 were due to lightning. Most fires were located in densely vegetated areas inaccessible by road – similar to the historical locations. (The percentage is double that in the historical data, though, probably because the satellite hotspot data can see fire ignitions in locations inaccessible to fire experts).
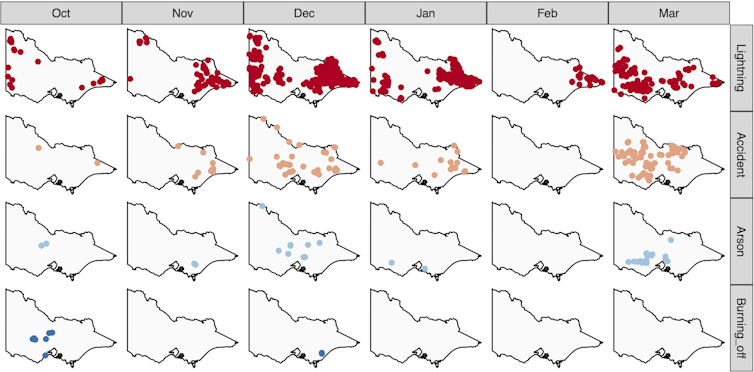
All fires in February 2020 were predicted to be due to lightning. Accident and arson were commonly predicted causes in March, and early in the season. Reassuringly, ignition due to burning off was predicted primarily in October 2019, prior to the fire restrictions.

Quicker fire ignition information
Our analysis used open-data and open-source software, and could be applied to fires elsewhere in Australia.
This analysis shows how we can quickly predict causes of bushfires, using satellite data combined with other information. It could reduce the work of fire forensics teams, and provide more complete fire ignition data in future.
The code used for the analysis can be found here. Explore the historical fire data, predictions for 2019-2020 fires, and a fire risk map for Victoria using this app.
This analysis is based on thesis research by Monash University Honours student Weihao Li. She was supervised by the author, and former Principal Inventive Scientist at AT&T Labs Research, Emily Dodwell. The Australian Centre of Excellence for Mathematical and Statistical Frontiers supported Emily’s travel to Australia to start this project. The full analysis is available here.
– ref. Open data shows lightning, not arson, was the likely cause of most Victorian bushfires last summer – https://theconversation.com/open-data-shows-lightning-not-arson-was-the-likely-cause-of-most-victorian-bushfires-last-summer-151912


