Source: The Conversation (Au and NZ) – By Joel Miller, Senior lecturer, Applied Mathematics, La Trobe University
Scott Morrison yesterday warned Australians will face at least six months of disturbance to our day-to-day lives as we navigate the coronavirus pandemic.
Social distancing measures such as restrictions on large group gatherings and events won’t just be in place until next week or the week after.
But where does that six month number come from?
It’s a combination of modelling and simulation using observational data from the COVID-19 pandemic worldwide, and historical data from past pandemics.
Read more: Explainer: what is herd immunity?
Pandemics past
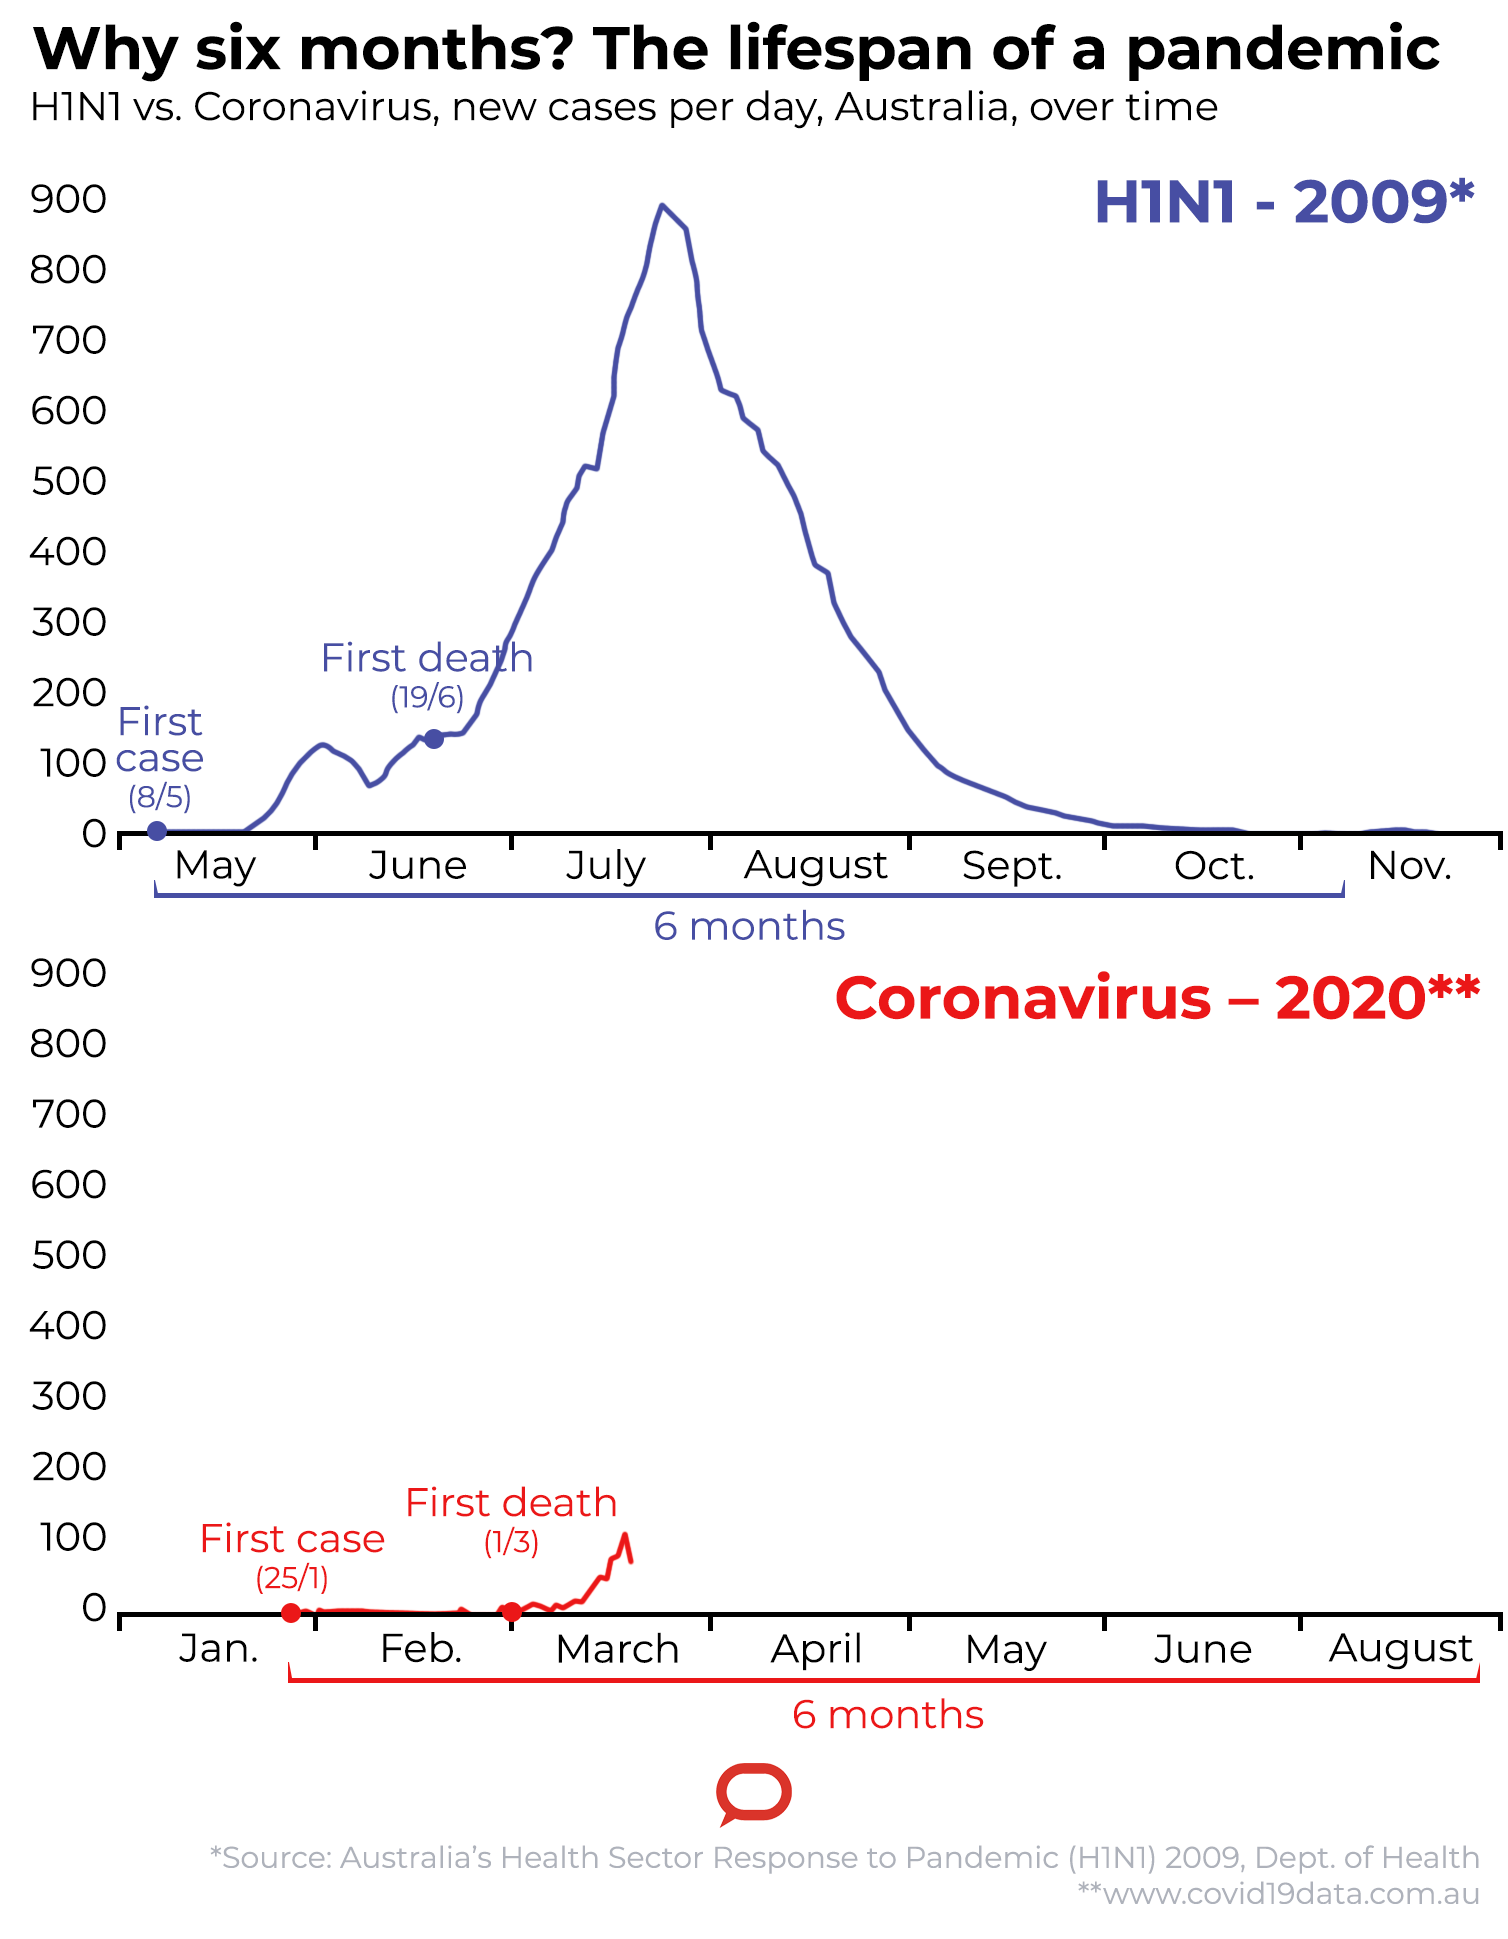
By way of comparison, the H1N1 influenza pandemic reached Australia in early May 2009 and finally petered out five to six months later.
This was because of seasonal changes as well as more and more people becoming immune to the infection (that’s the concept of herd immunity).
Mathematical modelling
Based on observed early growth rates, in the absence of any containment measures, we would anticipate COVID-19 to have a similar epidemic curve to H1N1.
We can predict this using disease parameters estimated from Chinese and European data and a highly simplified mathematical model.
The typical infected person causes about 2.5 new infections (this is called the reproduction number, or R0).
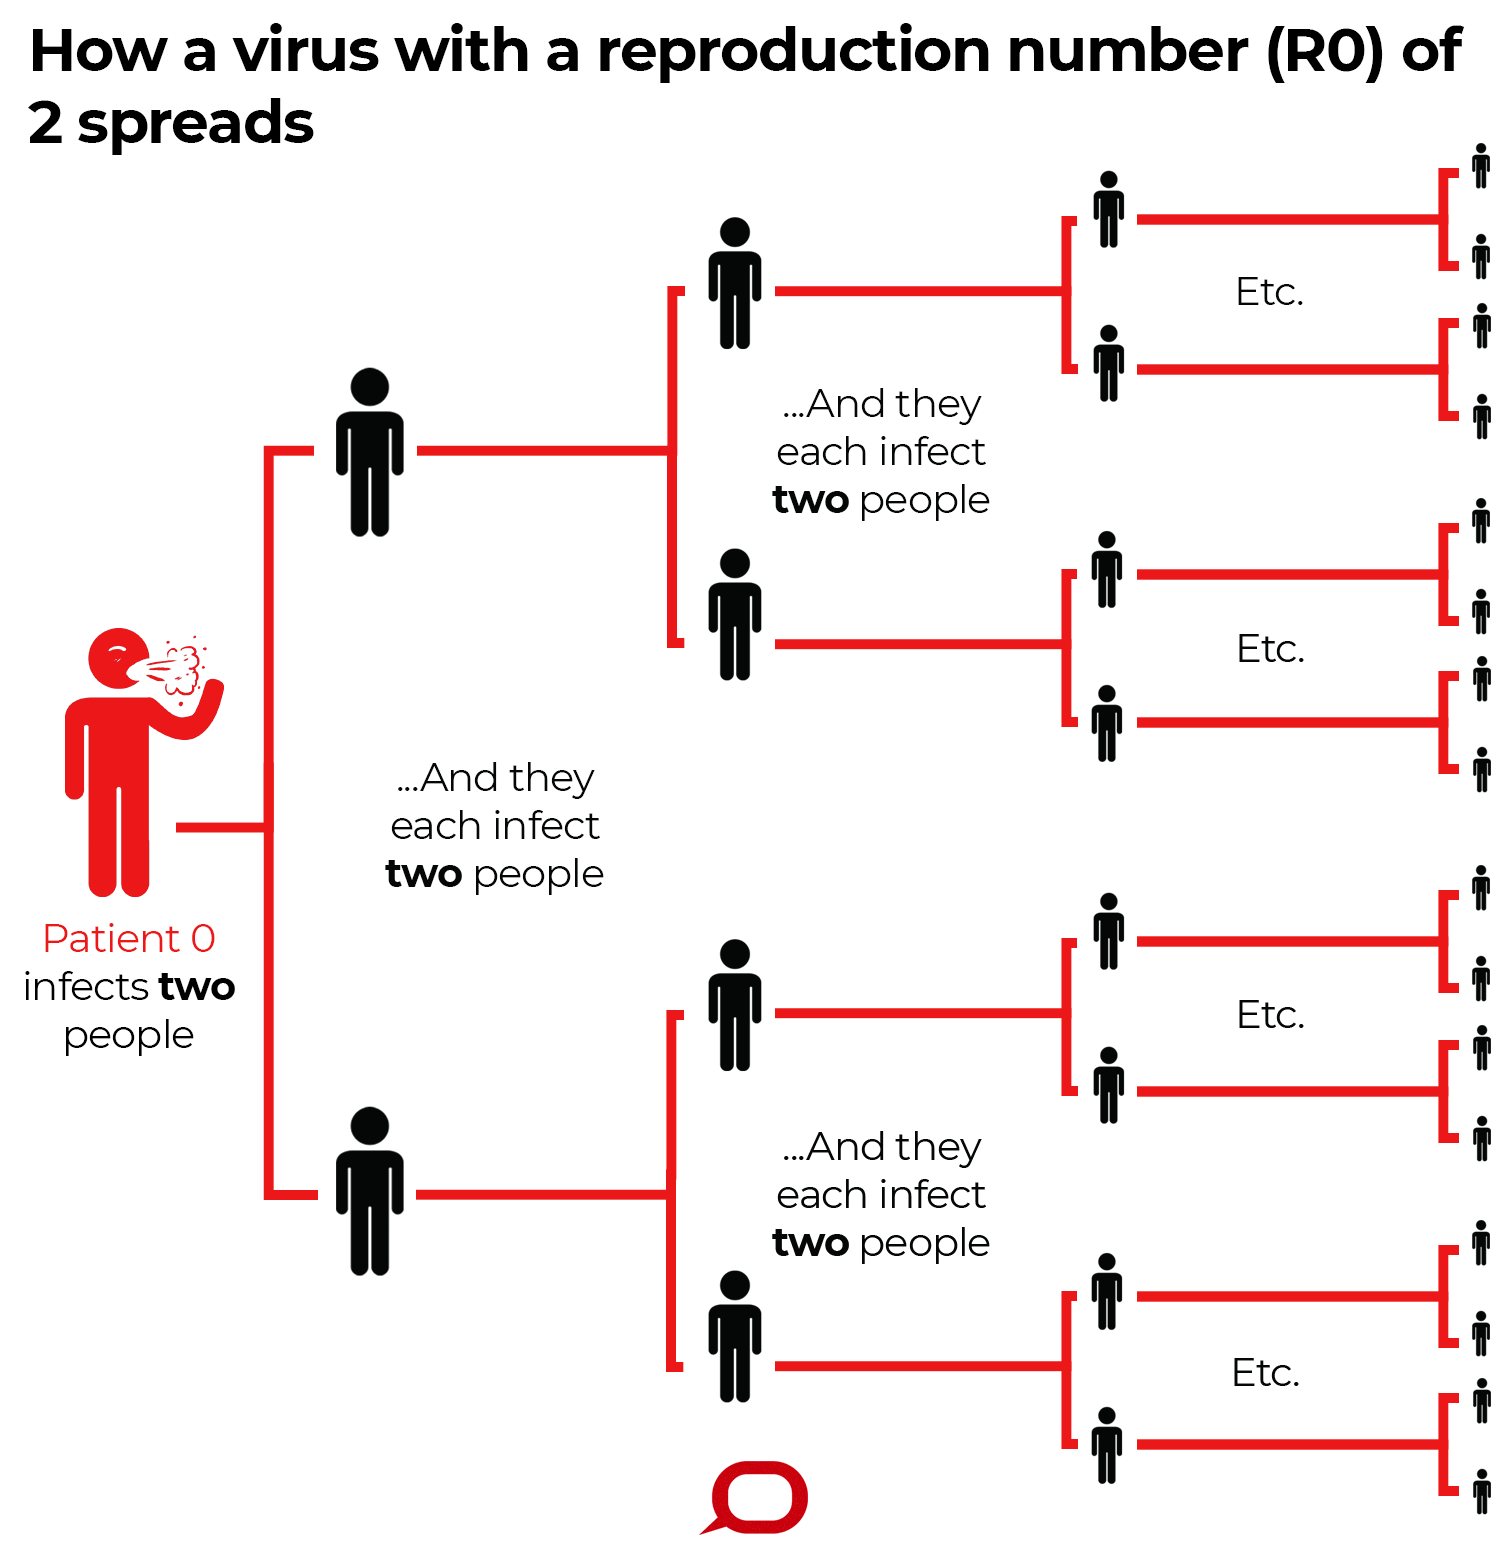
Without any intervention, the epidemic would grow until depletion of susceptible people slows the growth. The prevalence would start to fall when the susceptible population reaches what’s called a critical fraction, 1/R0. Once we pass this threshold a person with COVID-19 will only transmit the virus to less than one other person (because fewer people remain susceptible to infection).
For a population of 25 million like Australia, this would require 15 about million infections.
COVID-19’s observed doubling time has been about four days. That means every four days the number of cases has been roughly double what it was four days prior.
We would calculate it takes about three months for one infection doubling every four days to cause 15 million infections. After the peak, we expect the total time to drop to be about the same as it took to rise. This gives a crude prediction of six months.
Read more: How to flatten the curve of coronavirus, a mathematician explains
Since we’re presumably partway into the epidemic, we might expect less than six months remaining. However, reality introduces many adjustments to this: the doubling slows down as we approach the peak, there is variation in individual behaviours, the geographic structure of Australia will influence the spread, and social distancing will have an impact.
Thankfully, these adjustments significantly lower the predicted number of infections and the predicted peak prevalence, while the duration increases.
Computer simulations
To make our model more realistic we turn to computer simulations. These simulations draw on sources like census data and transportation networks to predict how disease would spread through a population.
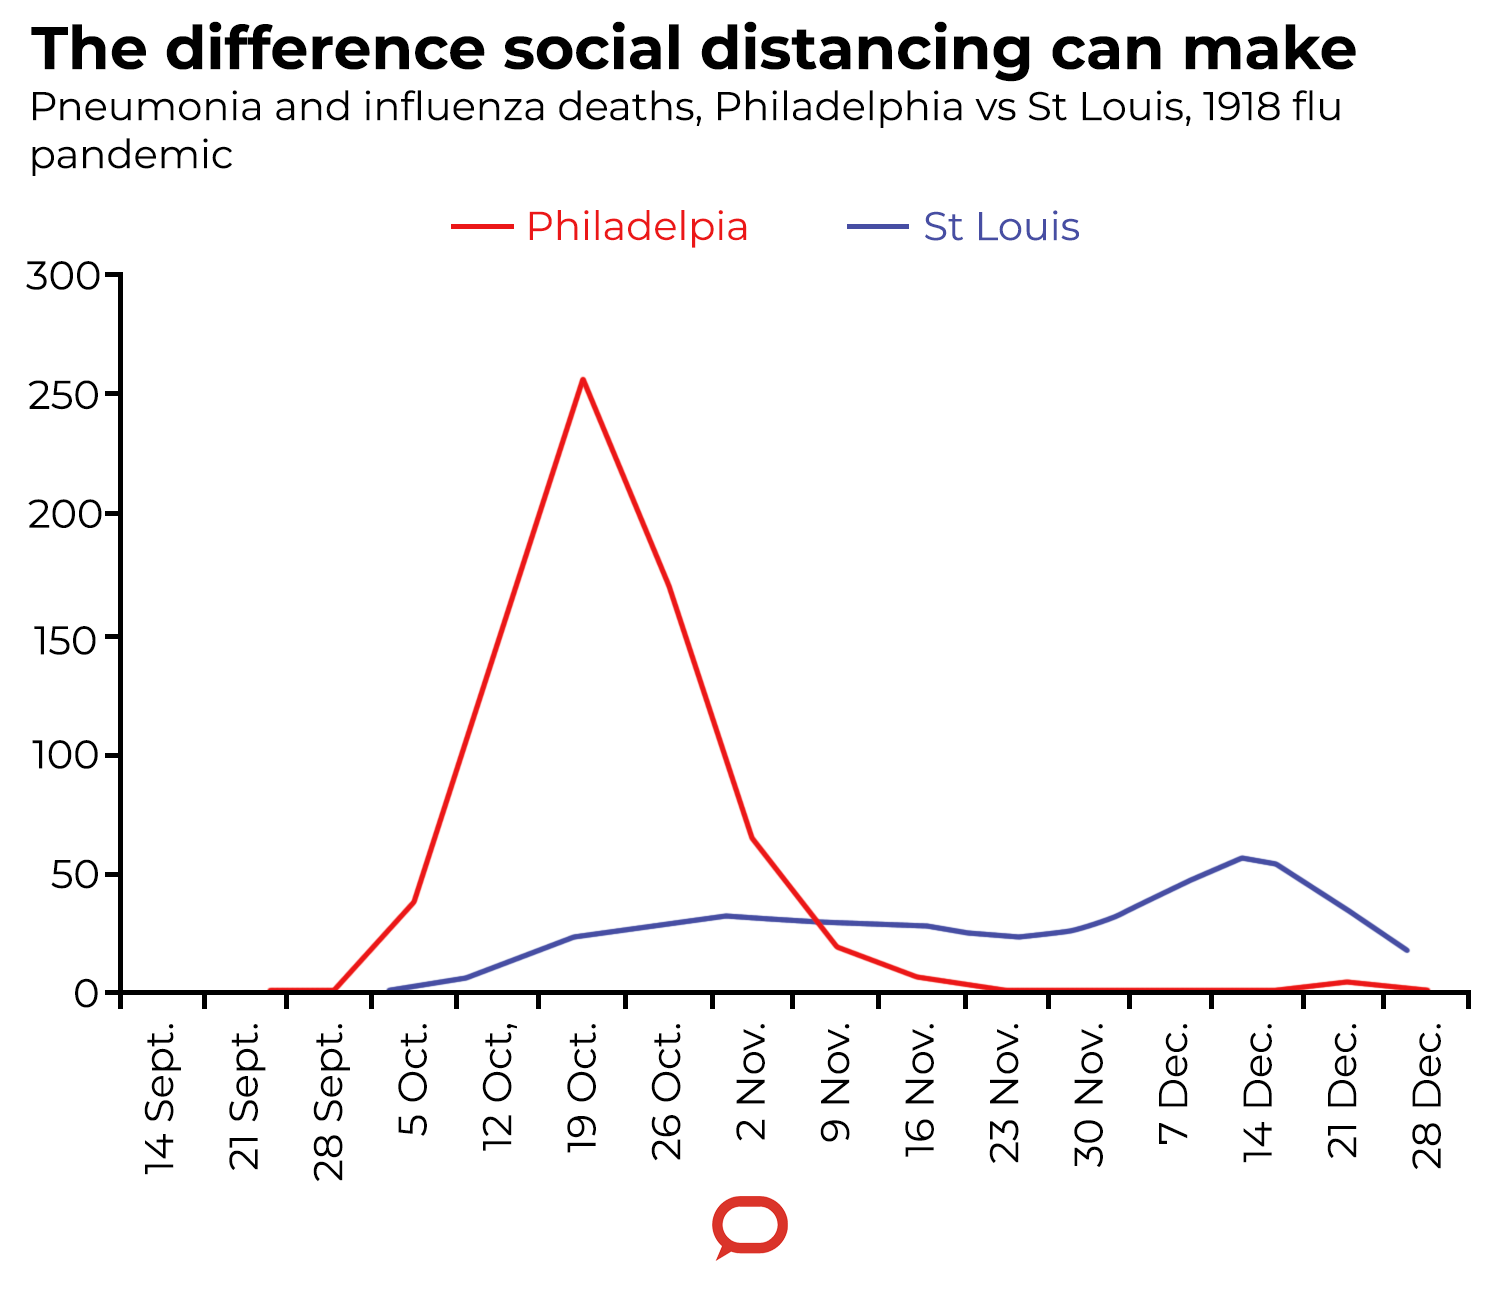
When we introduce interventions like those Scott Morrison has announced, our simulations show us COVID-19 infects fewer people and has a lower peak, but it lasts longer because it takes longer for immunity to build up. This is called flattening the curve.
In the case of COVID-19, we must intervene and do so aggressively. We cannot wait for herd immunity to develop. Unlike the H1N1 pandemic, where Australia only reported 191 deaths, COVID-19 threatens to overwhelm our health system many times over.
Interventions like social distancing, by facilitating fewer infections, can give us time to obtain more ventilators and other essential equipment, and develop improved control strategies. These might rely on new phone apps for contact tracing, or increased testing, for example.
If these measures are effective enough, perhaps we can drive the reproductive number below 1 and then progressively relax interventions while keeping our hospitals below capacity.
At the very least, the government’s advice on social distancing will flatten the curve and extend the epidemic so more patients arrive at hospitals that have capacity to treat them. We’ll need to have these measures in place for at least six months.
There are many uncertainties, but I’m hoping for a long-lasting epidemic.
Read more: How do we detect if coronavirus is spreading in the community?
– ref. Scott Morrison has said we’ll face at least 6 months of disruption. Where does that number come from? – https://theconversation.com/scott-morrison-has-said-well-face-at-least-6-months-of-disruption-where-does-that-number-come-from-134025