
Source: The Conversation (Au and NZ) – By Somwrita Sarkar, Senior Lecturer in Design and Computation, University of Sydney
The Greater Sydney Commission has proposed a 40-year vision of a metropolitan region formed of three “cities”: the Eastern “Harbour” City, the Central “River” City, and the Western “Parkland” City. The plan aims to create 30-minute cities, where the community has access to jobs and services in three largely self-contained but connected regions. Thus, Sydney would be polycentric.

A polycentric city has multiple centres of employment, economic or social activity. Local labour markets and residential zones minimise long commutes, create a sense of place and neighbourhood, and strengthen economic agglomeration as companies, services and industries benefit from being close to one another.
Read more: Another tale of two cities: access to jobs divides Sydney along the ‘latte line’
However, it is still unclear whether Sydney is actually moving towards such a structure. In our recent work, we developed new ways of measuring polycentricity. We applied these to Journey to Work data from the 2016 Census to test how consistent the current centricity patterns of Greater Sydney are with the proposed plan.
How do you measure polycentricity?
Traditionally, employment densities are used as a measure of polycentricity. If the density of jobs in a location is higher than the average density for the entire region, then it is a centre.
However, this simple measure misses a key notion that makes cities what they are: network flows and spatial interactions. People “flow” from one place to another. Employment centres “attract” flows, and residential areas “produce” flows. Thus, a city is a collection of locations that interact dynamically, connected by daily commuting flows.
We proposed a set of new metrics to capture this idea of flows. We defined the net inflow of people to a location as the total number coming to this location to work minus the total number going from this location to work elsewhere. If the net inflows are positive, this place is a centre.
The chart below illustrates the idea. The base arc on the circle shows the number of people “flowing” out of a location to another location. The connecting arcs are coloured black if the net inflows into the focus regions (a), (b) or (c) are positive.
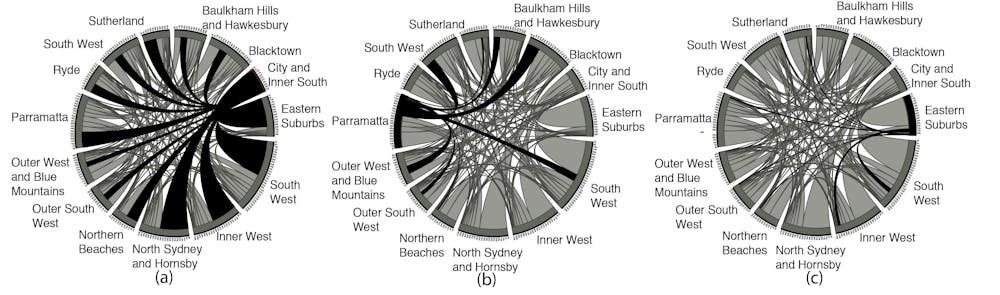
Sydney CBD clearly emerges as a global centre for the whole region. Parramatta is a regional centre. Other locations such as the Eastern Suburbs are not centres at all.
Read more: The future of Sydney: a tale of three cities?
The net inflow to a location can be divided by the total number of trips in the system, so inflow values are scaled from 0 to 1 using a standard statistical procedure. The higher the value, the higher the centre’s rank in the urban system. Here, a score of 1 means the centre is an absolute: all the trips in the system are a net inflow into the centre.
This gives us a trip-based centricity measure. And based on the area of the location, we can calculate a density-based centricity measure.
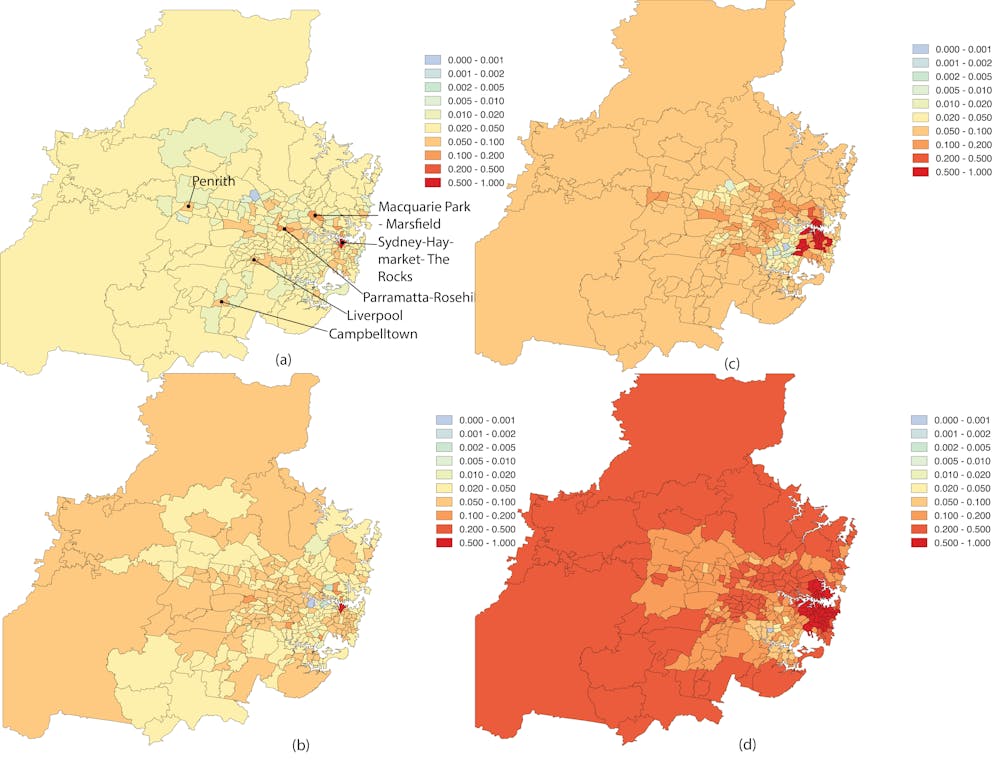
The maps below show trip-and-density-based measures – (a) and (b) respectively – for Greater Sydney at the Statistical Area Level 2 (representing a community that interacts together socially and economically).
Note the dominant role of the Sydney CBD. The other centres emerge as weak centres. Also, many of the second-order centres are very close to the CBD.
The concept of accessibility
Counting the net inflow into a location may provide us with information about general centricity. However, it still does not tell us how easy or difficult it is for people to actually get to jobs. This brings us to the idea of accessibility.
Walter Hansen defined accessibility as “the spatial distribution of activities about a point, adjusted for the ability and the desire of people … to overcome spatial separation”. More practically speaking, a location is accessible if it can be reached within a set time (say 30 minutes) from another location.
We counted the net accessibility of a location by counting the number of jobs minus the number of workers (labour) that could be accessed from a particular location (SA2) in Sydney within 30 minutes. We counted travel time both by car and by public transport during a usual weekday peak hour (Wednesday 8am). Similar to the trip and density measures, accessibility centricities can also be scaled as values between 0 and 1. This allows us to compare across the four measures.
In the maps above, (c) and (d) show the transit and auto-based accessibility centricities based on accessibility for public transport and vehicles. Sydney CBD is highly accessible. The second-order centres show much weaker accessibility.
Takeaways for urban policy and the three-cities plan
The chart below shows the top-ranked centre, Sydney CBD (Level 1 centre), and the lower-ranked subcentres (Levels 2 and 3) emerging from our analysis.

Accessibility planning should guide the design of a polycentric city
The design of polycentric Sydney should be guided by accessibility, the locations of jobs and homes, and subregional labour market organisation.
In short, the region should give priority to making jobs accessible by locating new jobs in emerging centres, instead of a mobility-focused system that takes people to jobs.
Reduce spatial mismatches between jobs and homes
Our results show that Sydney, paradoxically, remains strongly monocentric and strongly dispersed at the same time. The Sydney CBD accounts for 15% of jobs in the region, with the remaining 85% of jobs scattered around in weaker second-order centres and non-centres. Positive correlations exist between percentage of employed workers, trip-based centricity and the subcentre ranks.
But we see significant disparities between these ranks and accessibility centricities. This shows the spatial mismatches for commute lengths in the system.
A subcentre with high trip-centricity, employing a high percentage of workers, but relatively lower auto- and transit-based accessibility centricity, implies that even though a significant percentage of the population comes to this location to work, access to jobs at this centre within 30 minutes is low.
A policy response would be to increase the accessibility of jobs from this location, as it already serves as a centre. This situation is particularly clear in the cases of Parramatta-Rosehill and Macquarie Park-Marsfield. Penrith and Liverpool too have extremely weak accessibility centricity.
Read more: Reimagining Sydney with 3 CBDs: how far off is a Parramatta CBD?
Polycentric cities should promote spatial justice
As cities grow in size, commute lengths increase if the labour market for the entire metropolitan region is integrated. Commute lengths will stabilise if a city has a clear polycentric or modular structure.
In the case of Sydney, spatial equity has always been a concern. However, inter-city comparisons show city size has a strong bearing on its equity and efficiency.
Our results show it’s increasingly important for larger cities to introduce a framework of subregional labour markets as part of the polycentricity agenda. Enabling shorter commutes for workers will improve spatial equity as well as efficiencies.
– ref. How close is Sydney to the vision of creating three 30-minute cities? – http://theconversation.com/how-close-is-sydney-to-the-vision-of-creating-three-30-minute-cities-115847